The High-End Residential Real Estate Market in Portugal
High-end prices rise 8.5% as demand surges and supply resumes its decline
Portugal's high-end residential real estate market reached new highs in 2025. Prices rose 8.5% year-on-year, demand increased 12%, and supply continued to contract — creating a structural imbalance that sustains appreciation.
Q4 2024: 7,323 → Q4 2025: 7,945 EUR/m²
2024→2025 (-24.8% since 2021)
2024→2025
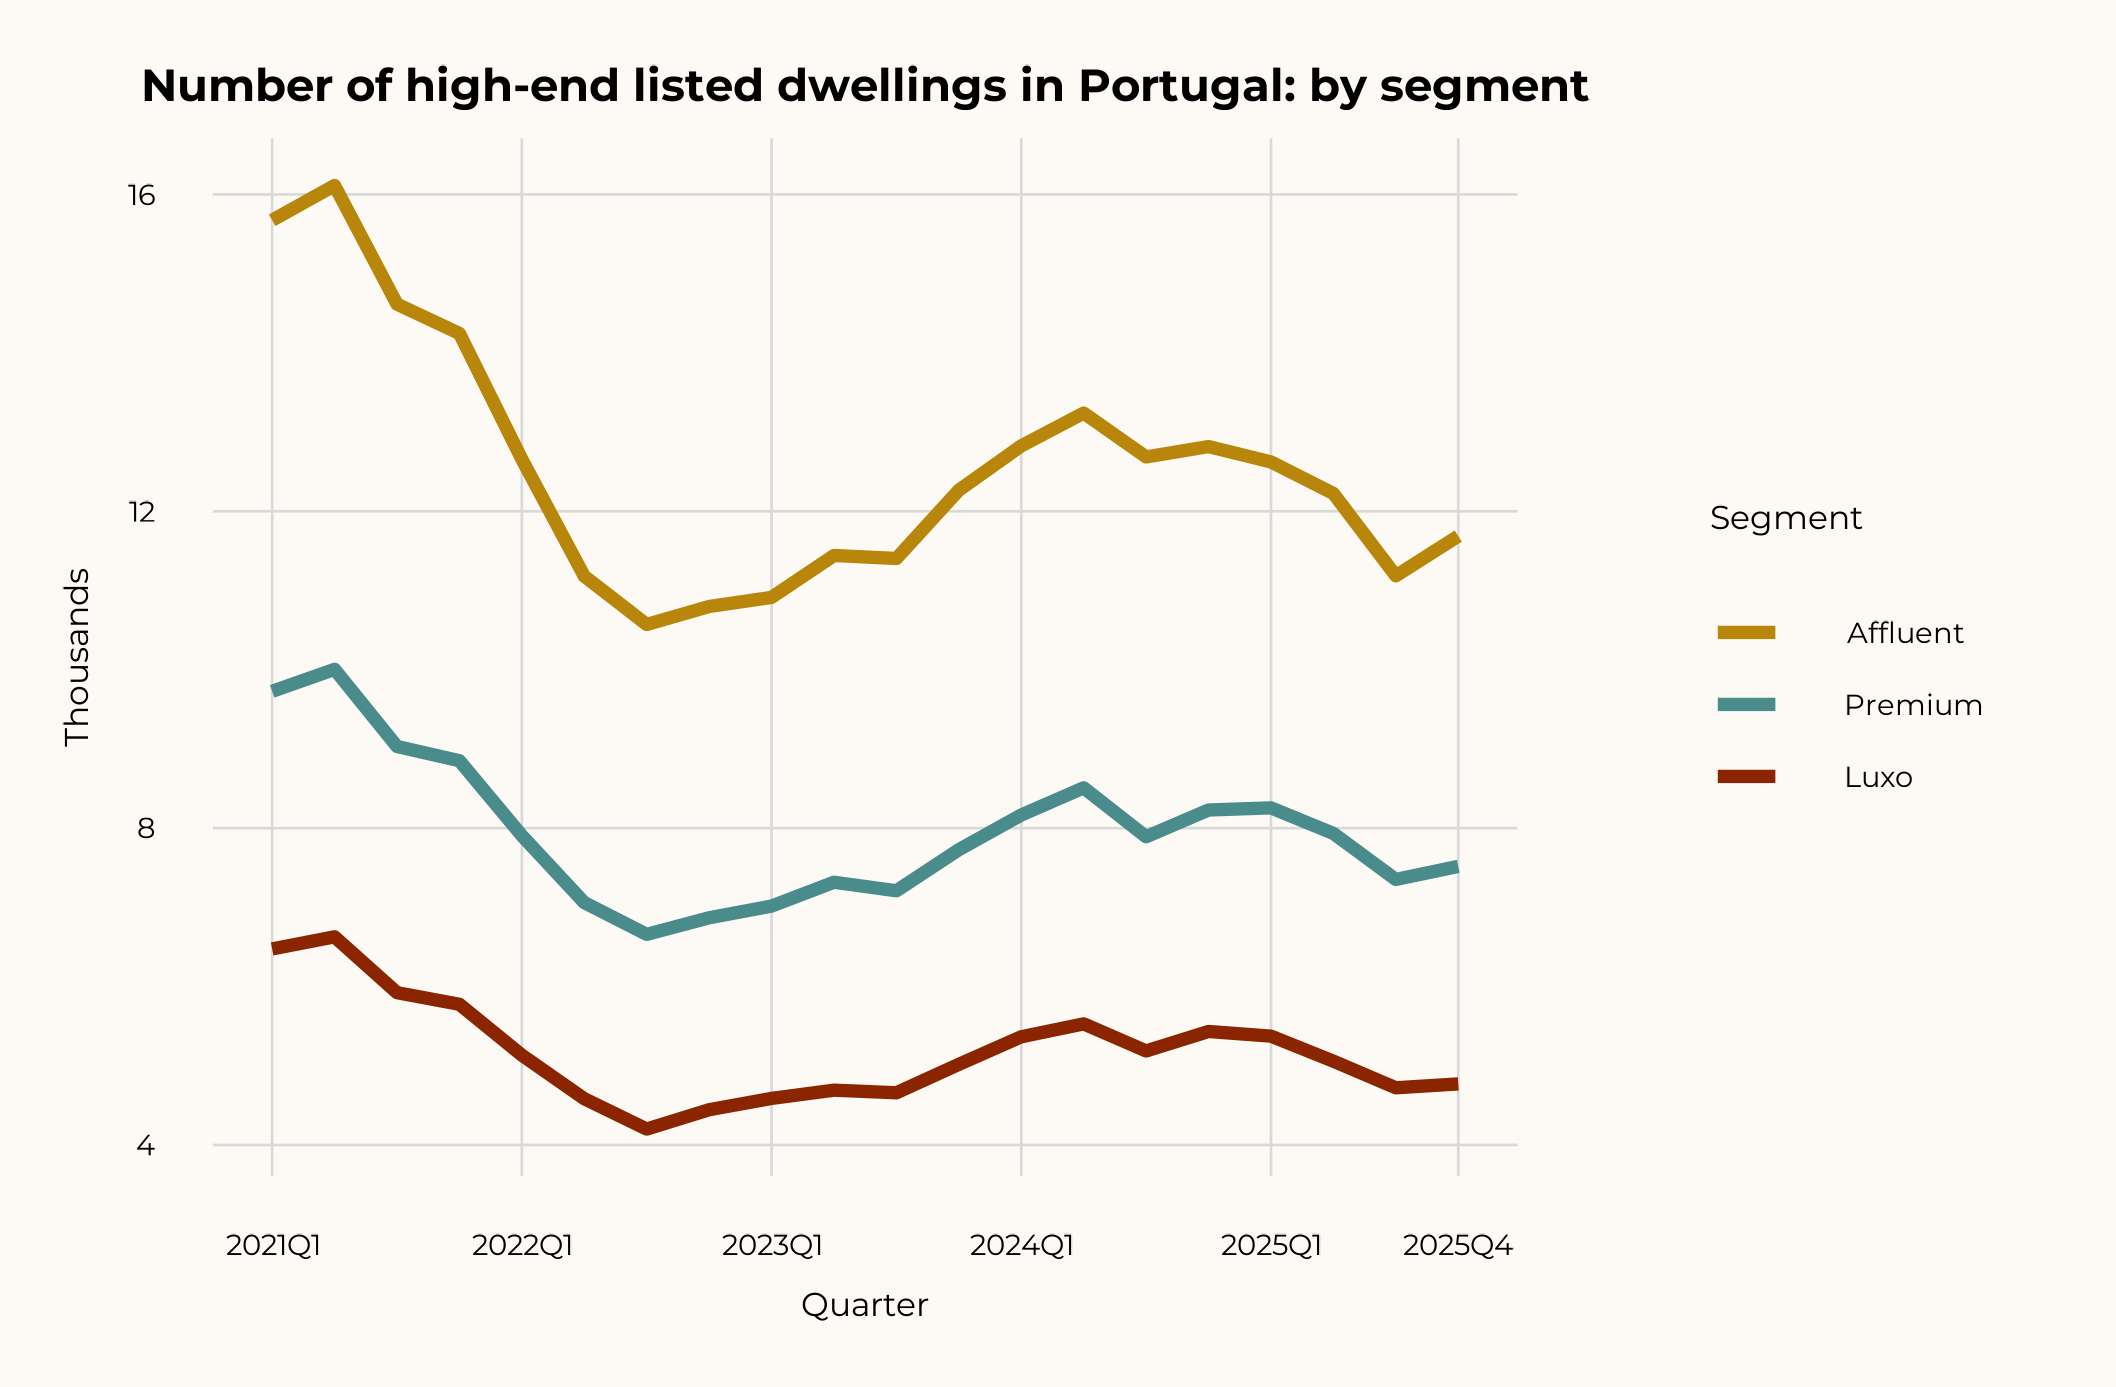
Affluent: 6,496 | Premium: 8,148 | Luxo: 11,176
7,300 apartments + 13,700 houses high-end units available (Q4 2025)
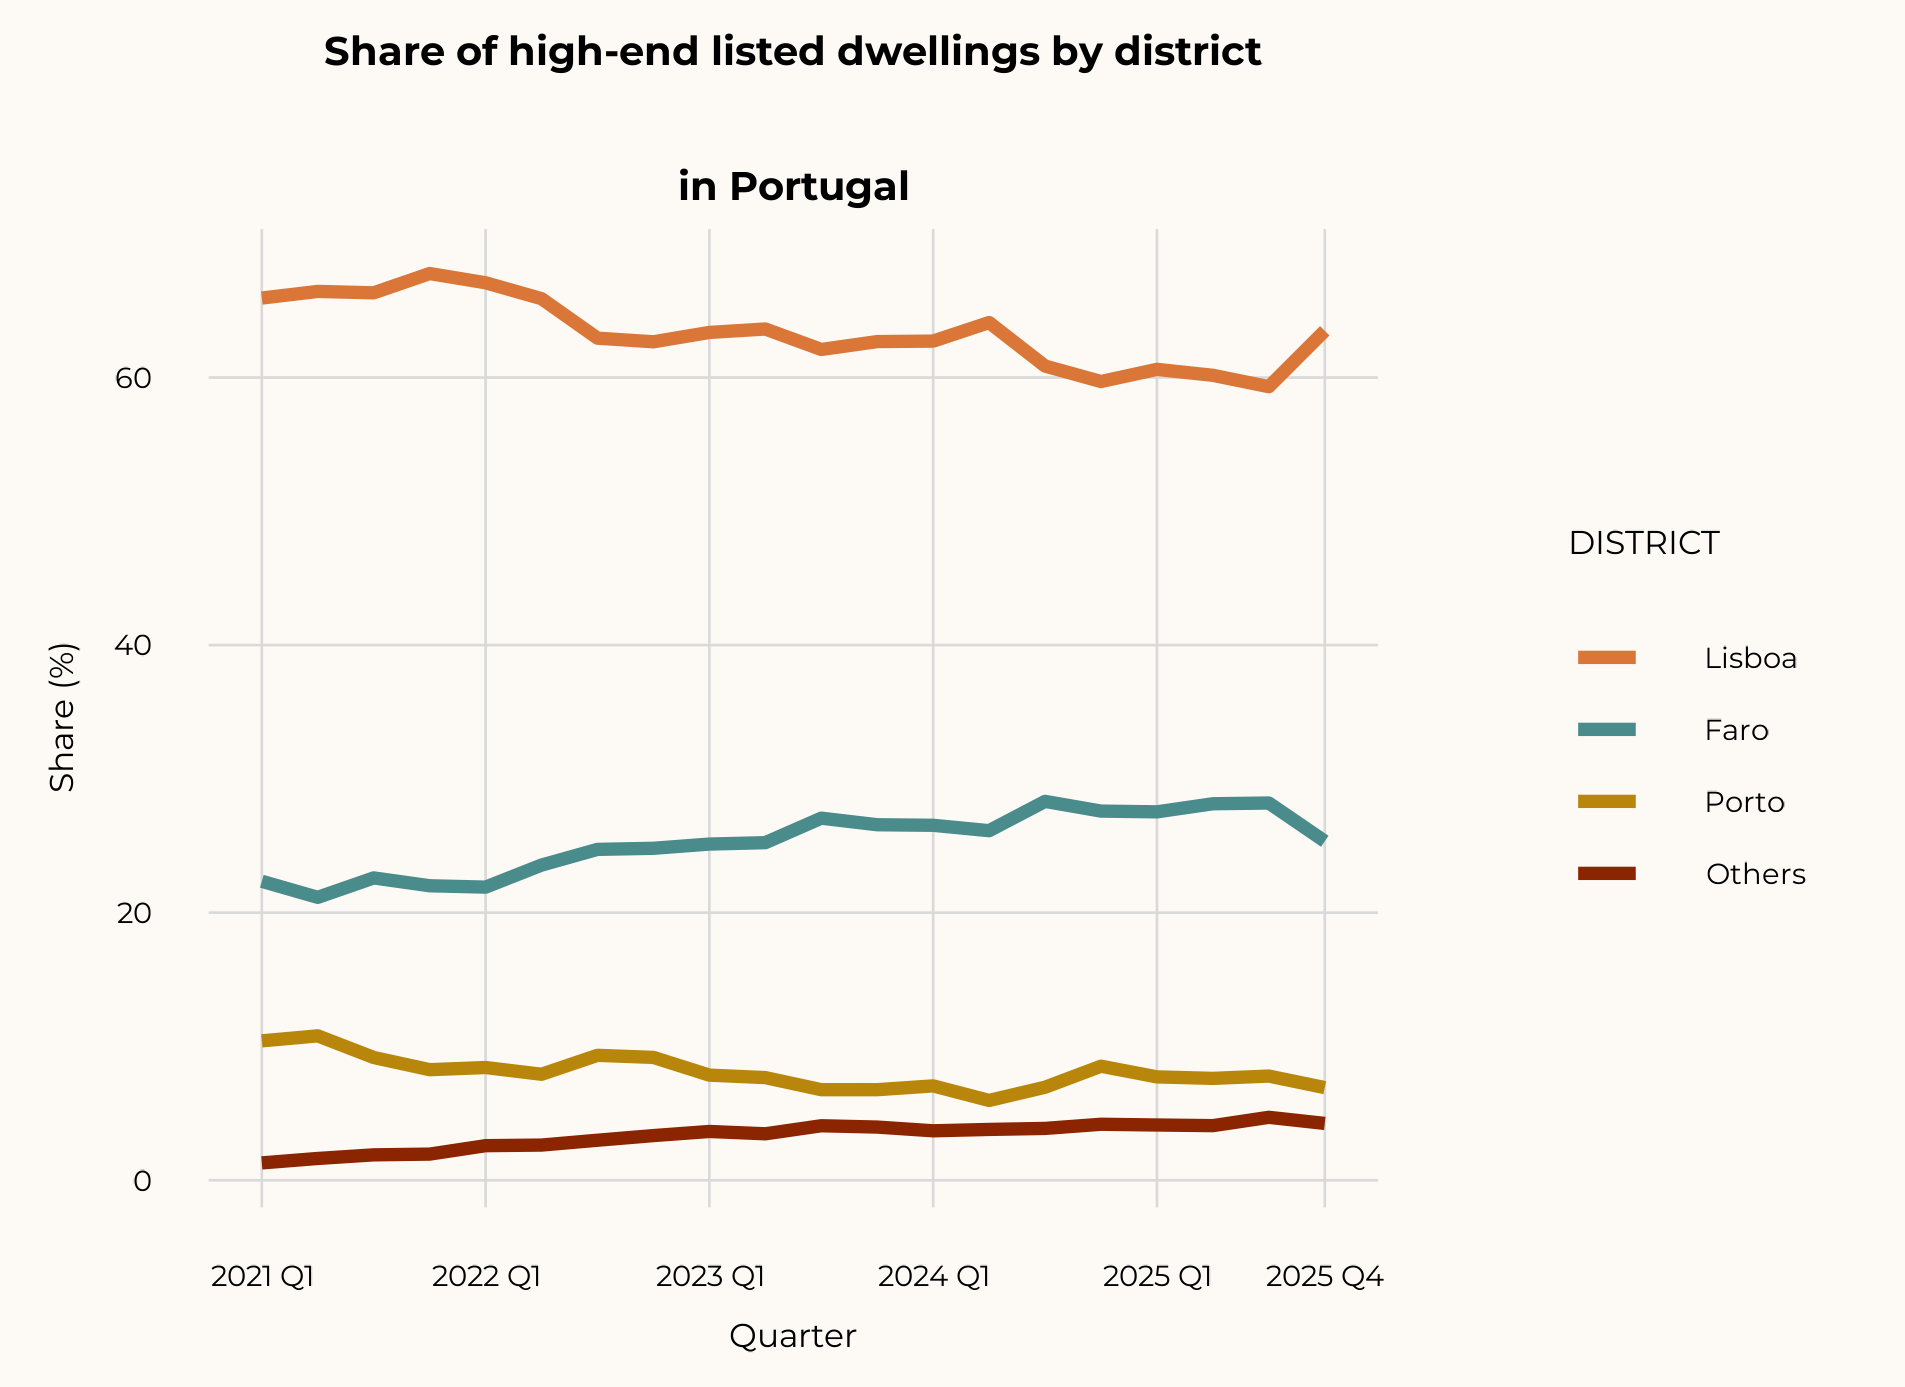
Q1 2021 → Q4 2025
The high-end segment is defined by the top price percentiles of the market
Objectives
- Map the supply of high-end residential properties in Portugal
- Quantify demand and pressure on the high-end segment
- Analyze price trends and appreciation drivers
- Estimate the economic impact of the luxury segment on the Portuguese economy
Data Sources
- Idealista — Supply, prices, demand by segment and district
- Confidencial Imobiliário — Transactions, volume, average price per m²
- INE — Permits, construction costs, bank valuations
- Knight Frank / Savills — International luxury benchmarks
Each quarter, listed properties are ranked by price/m² and segmented by percentiles of the national distribution. Thresholds adjust automatically to market movements.
6,496 EUR/m²
Q4 2025
8,148 EUR/m²
Q4 2025
11,176 EUR/m²
Q4 2025
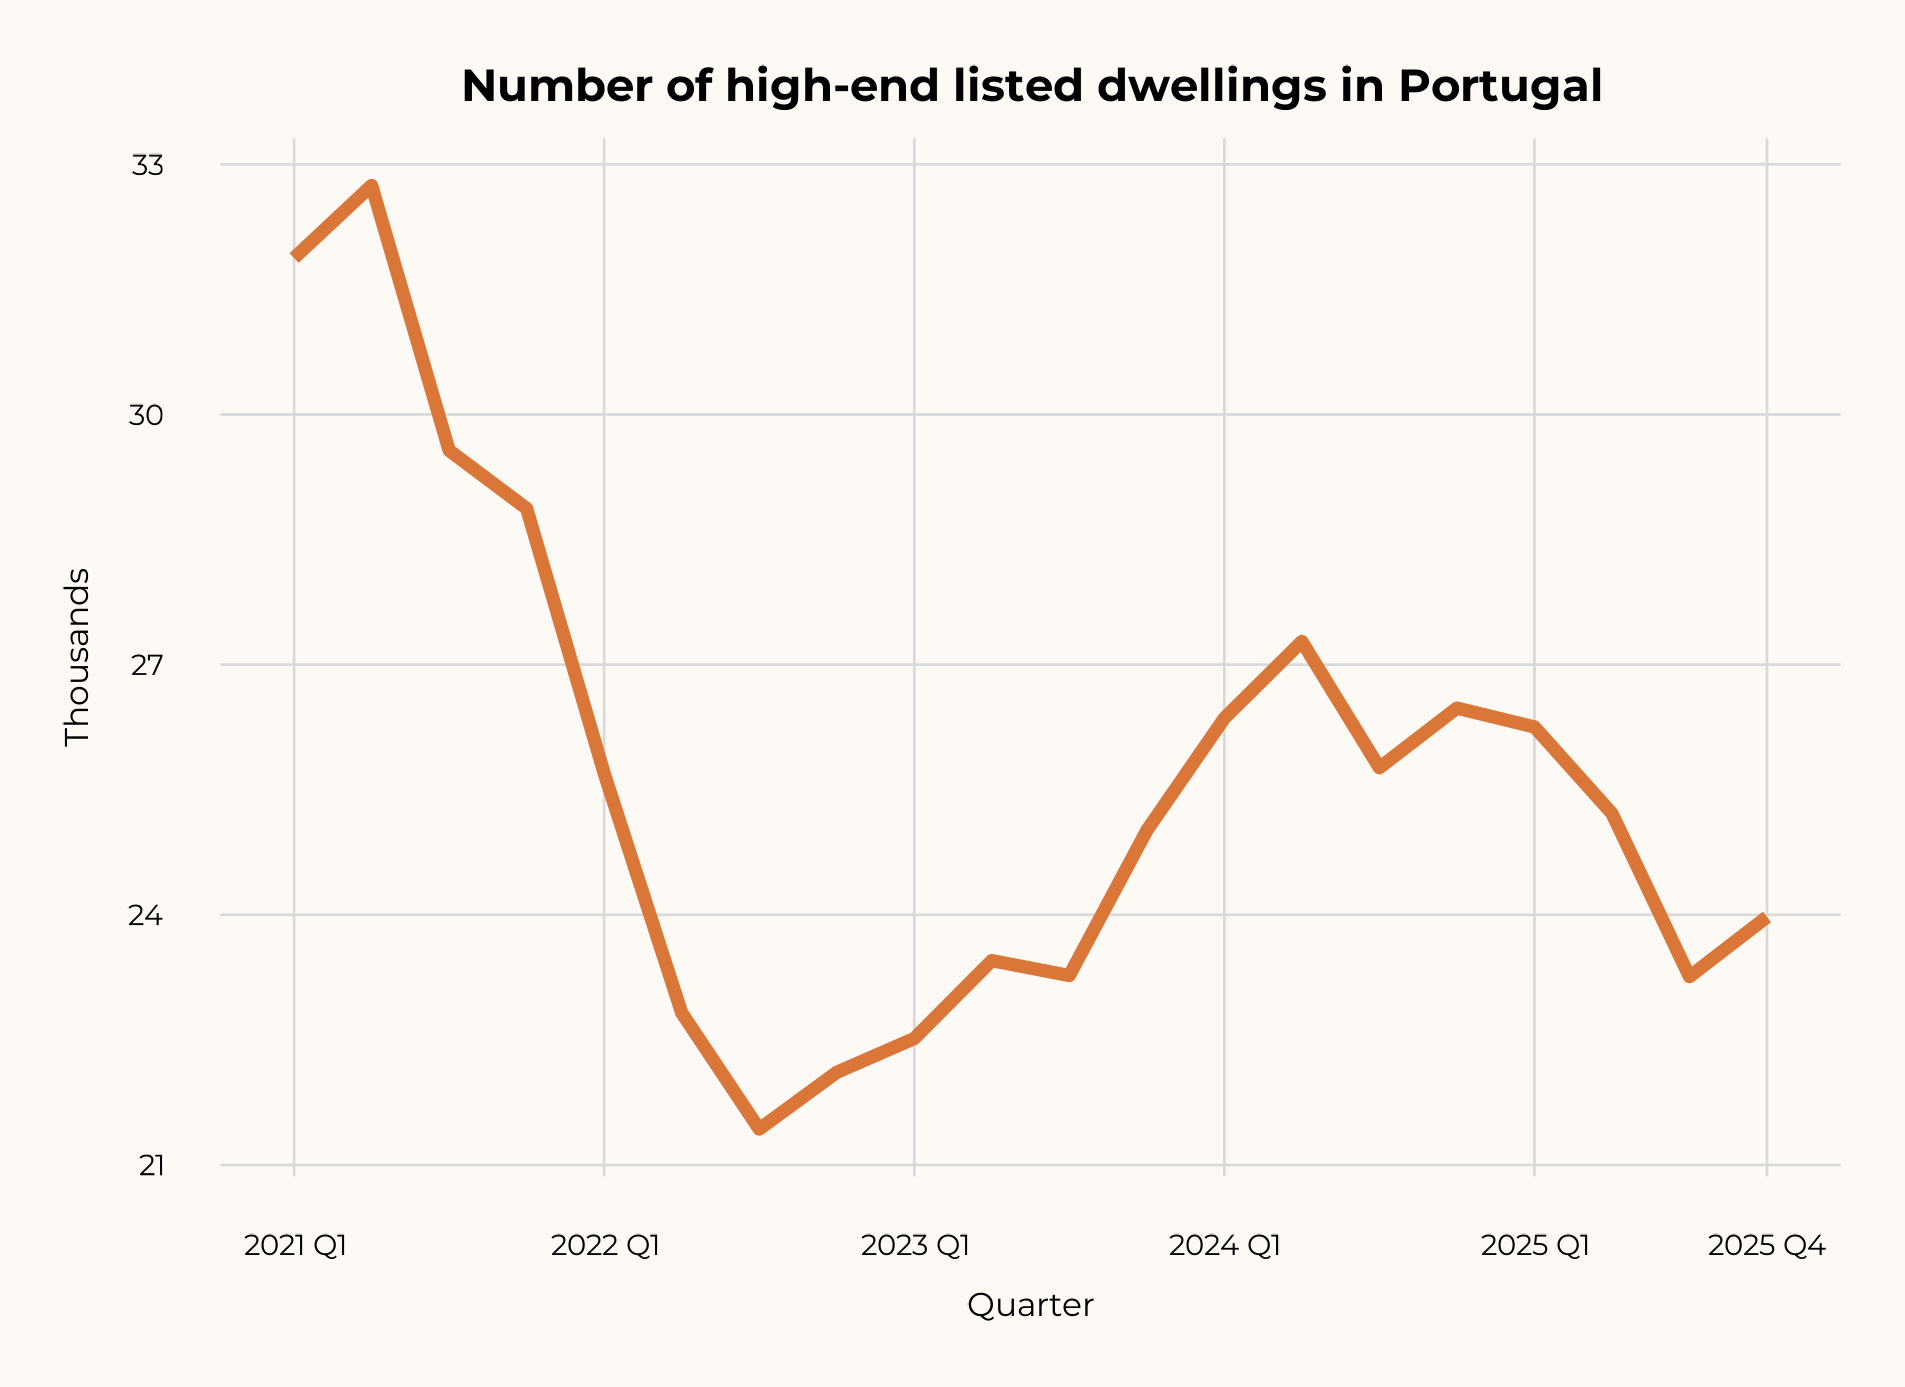
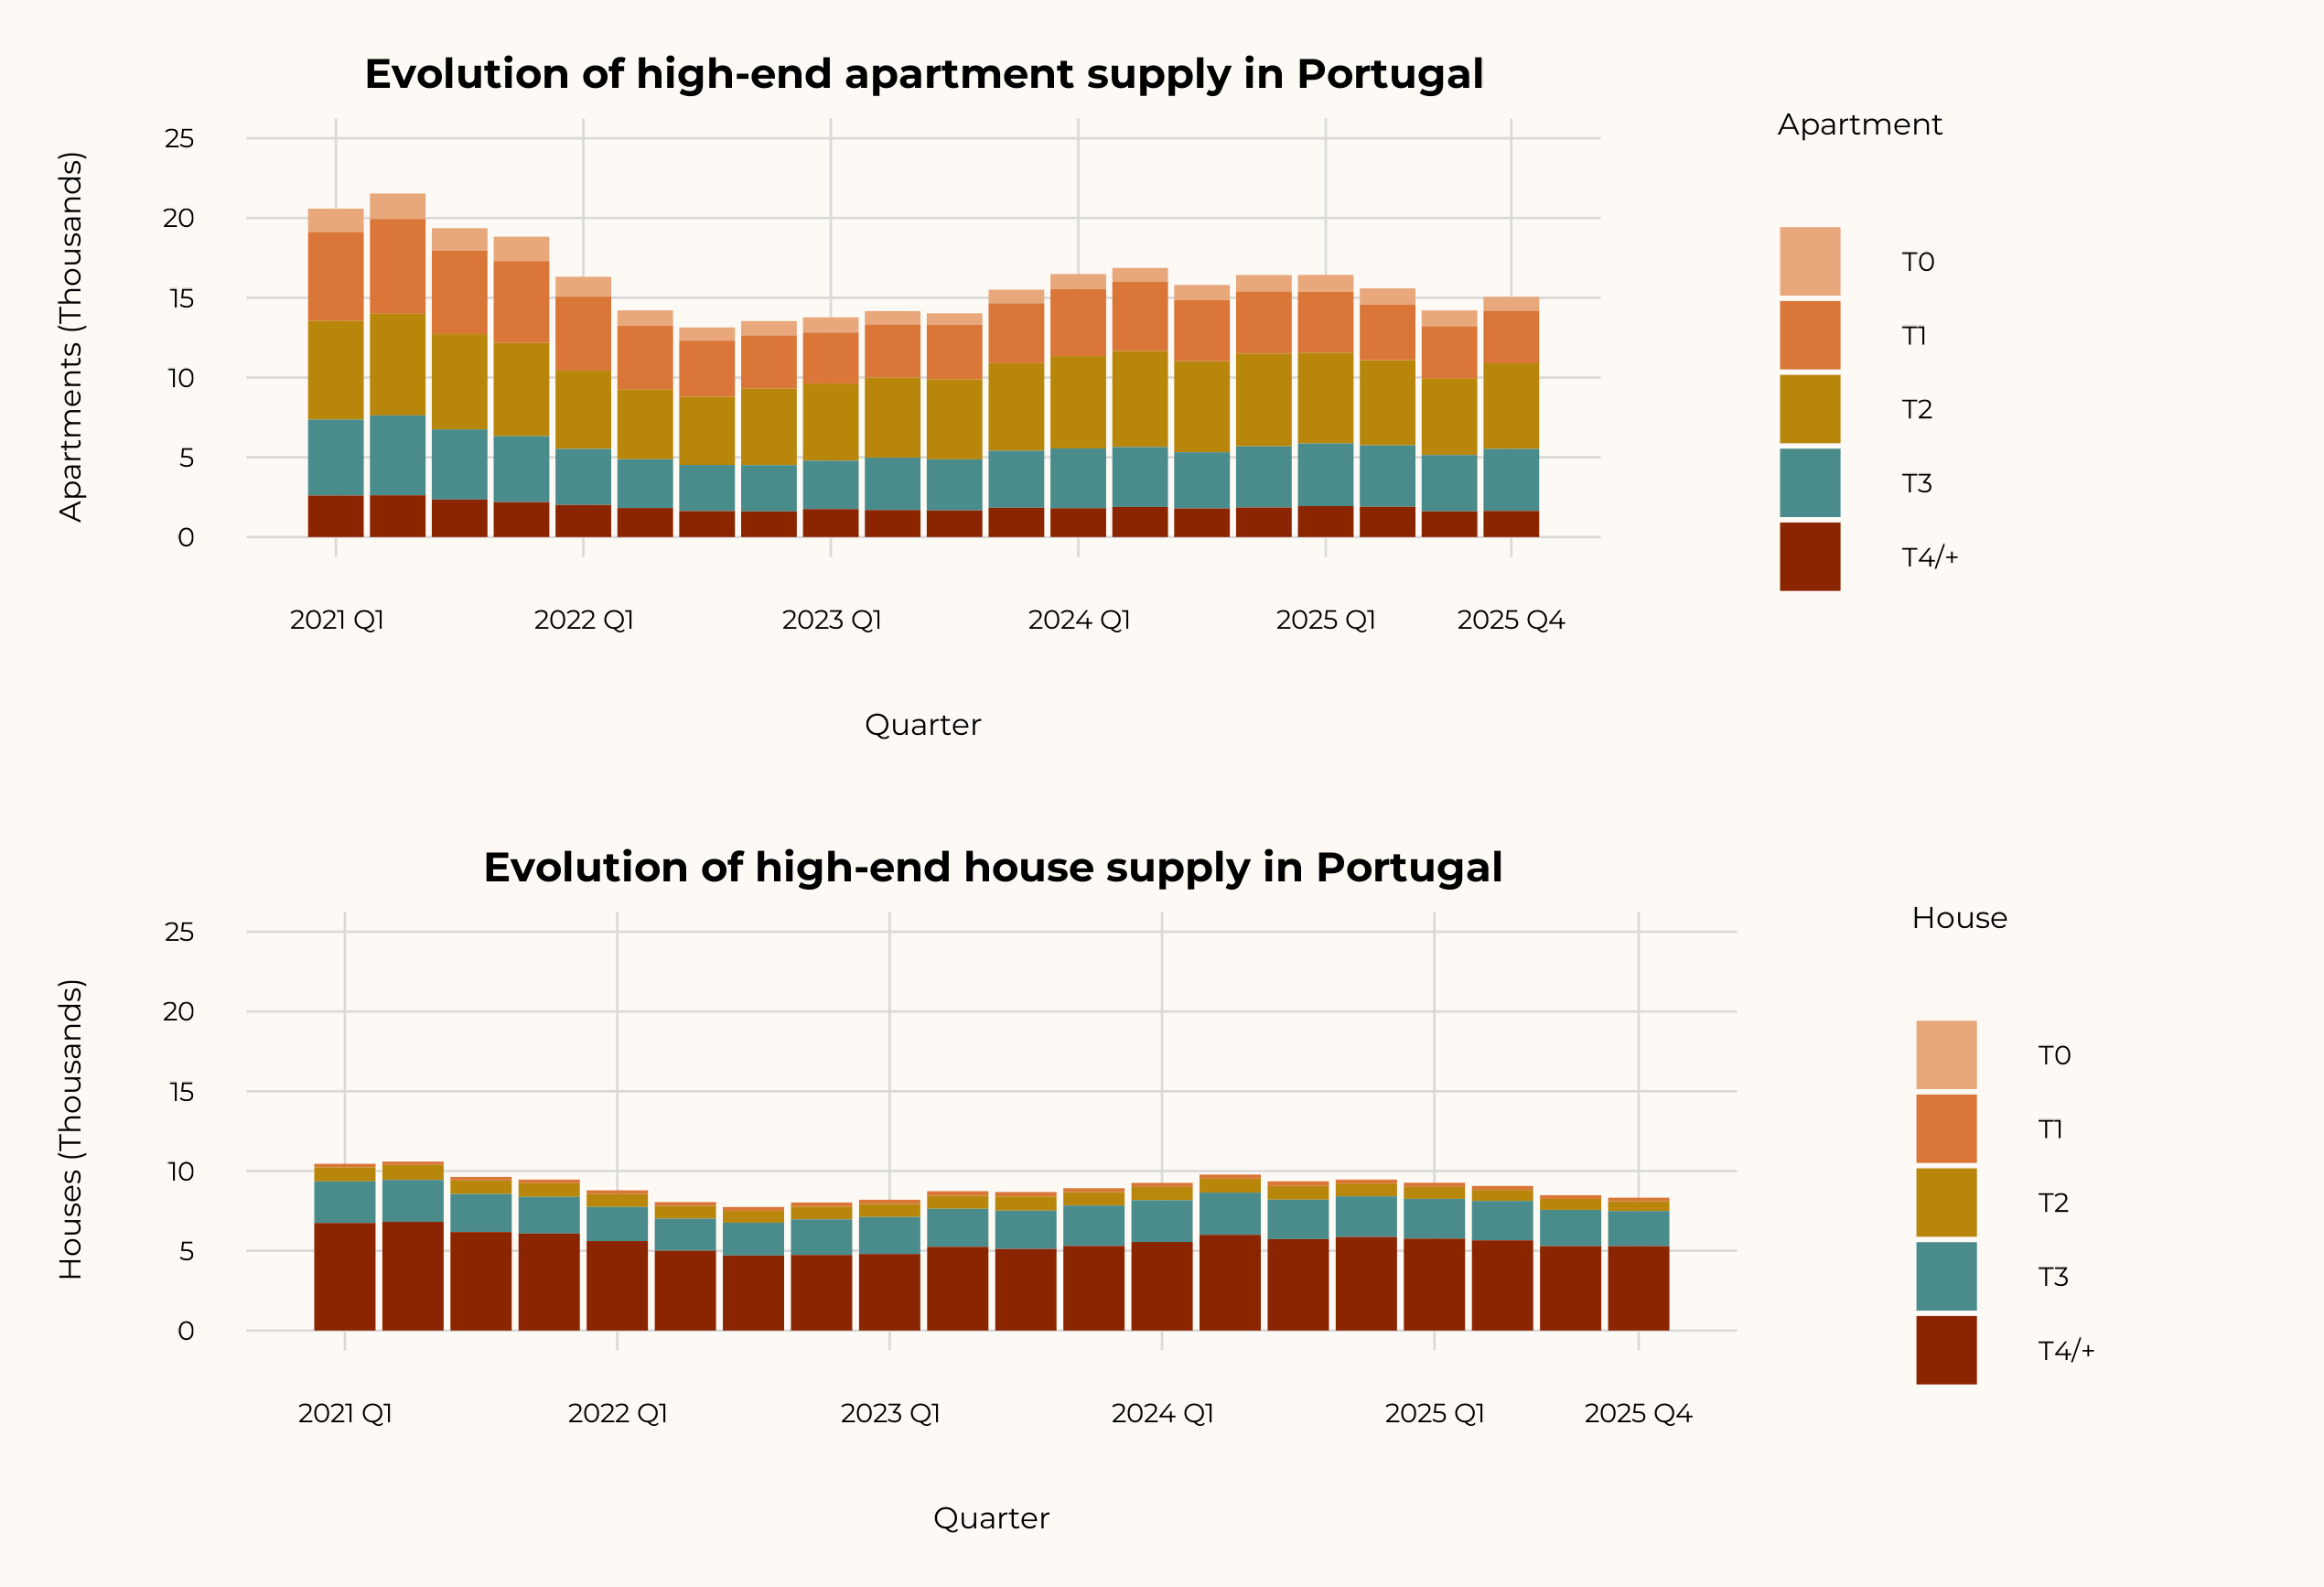
High-end supply fell nearly 25% since 2021 despite a recent partial recovery
The high-end market lost a quarter of its available supply in four years. Despite a slight quarterly recovery of +3.1% in Q4 2025, the structural trend remains contractionary.
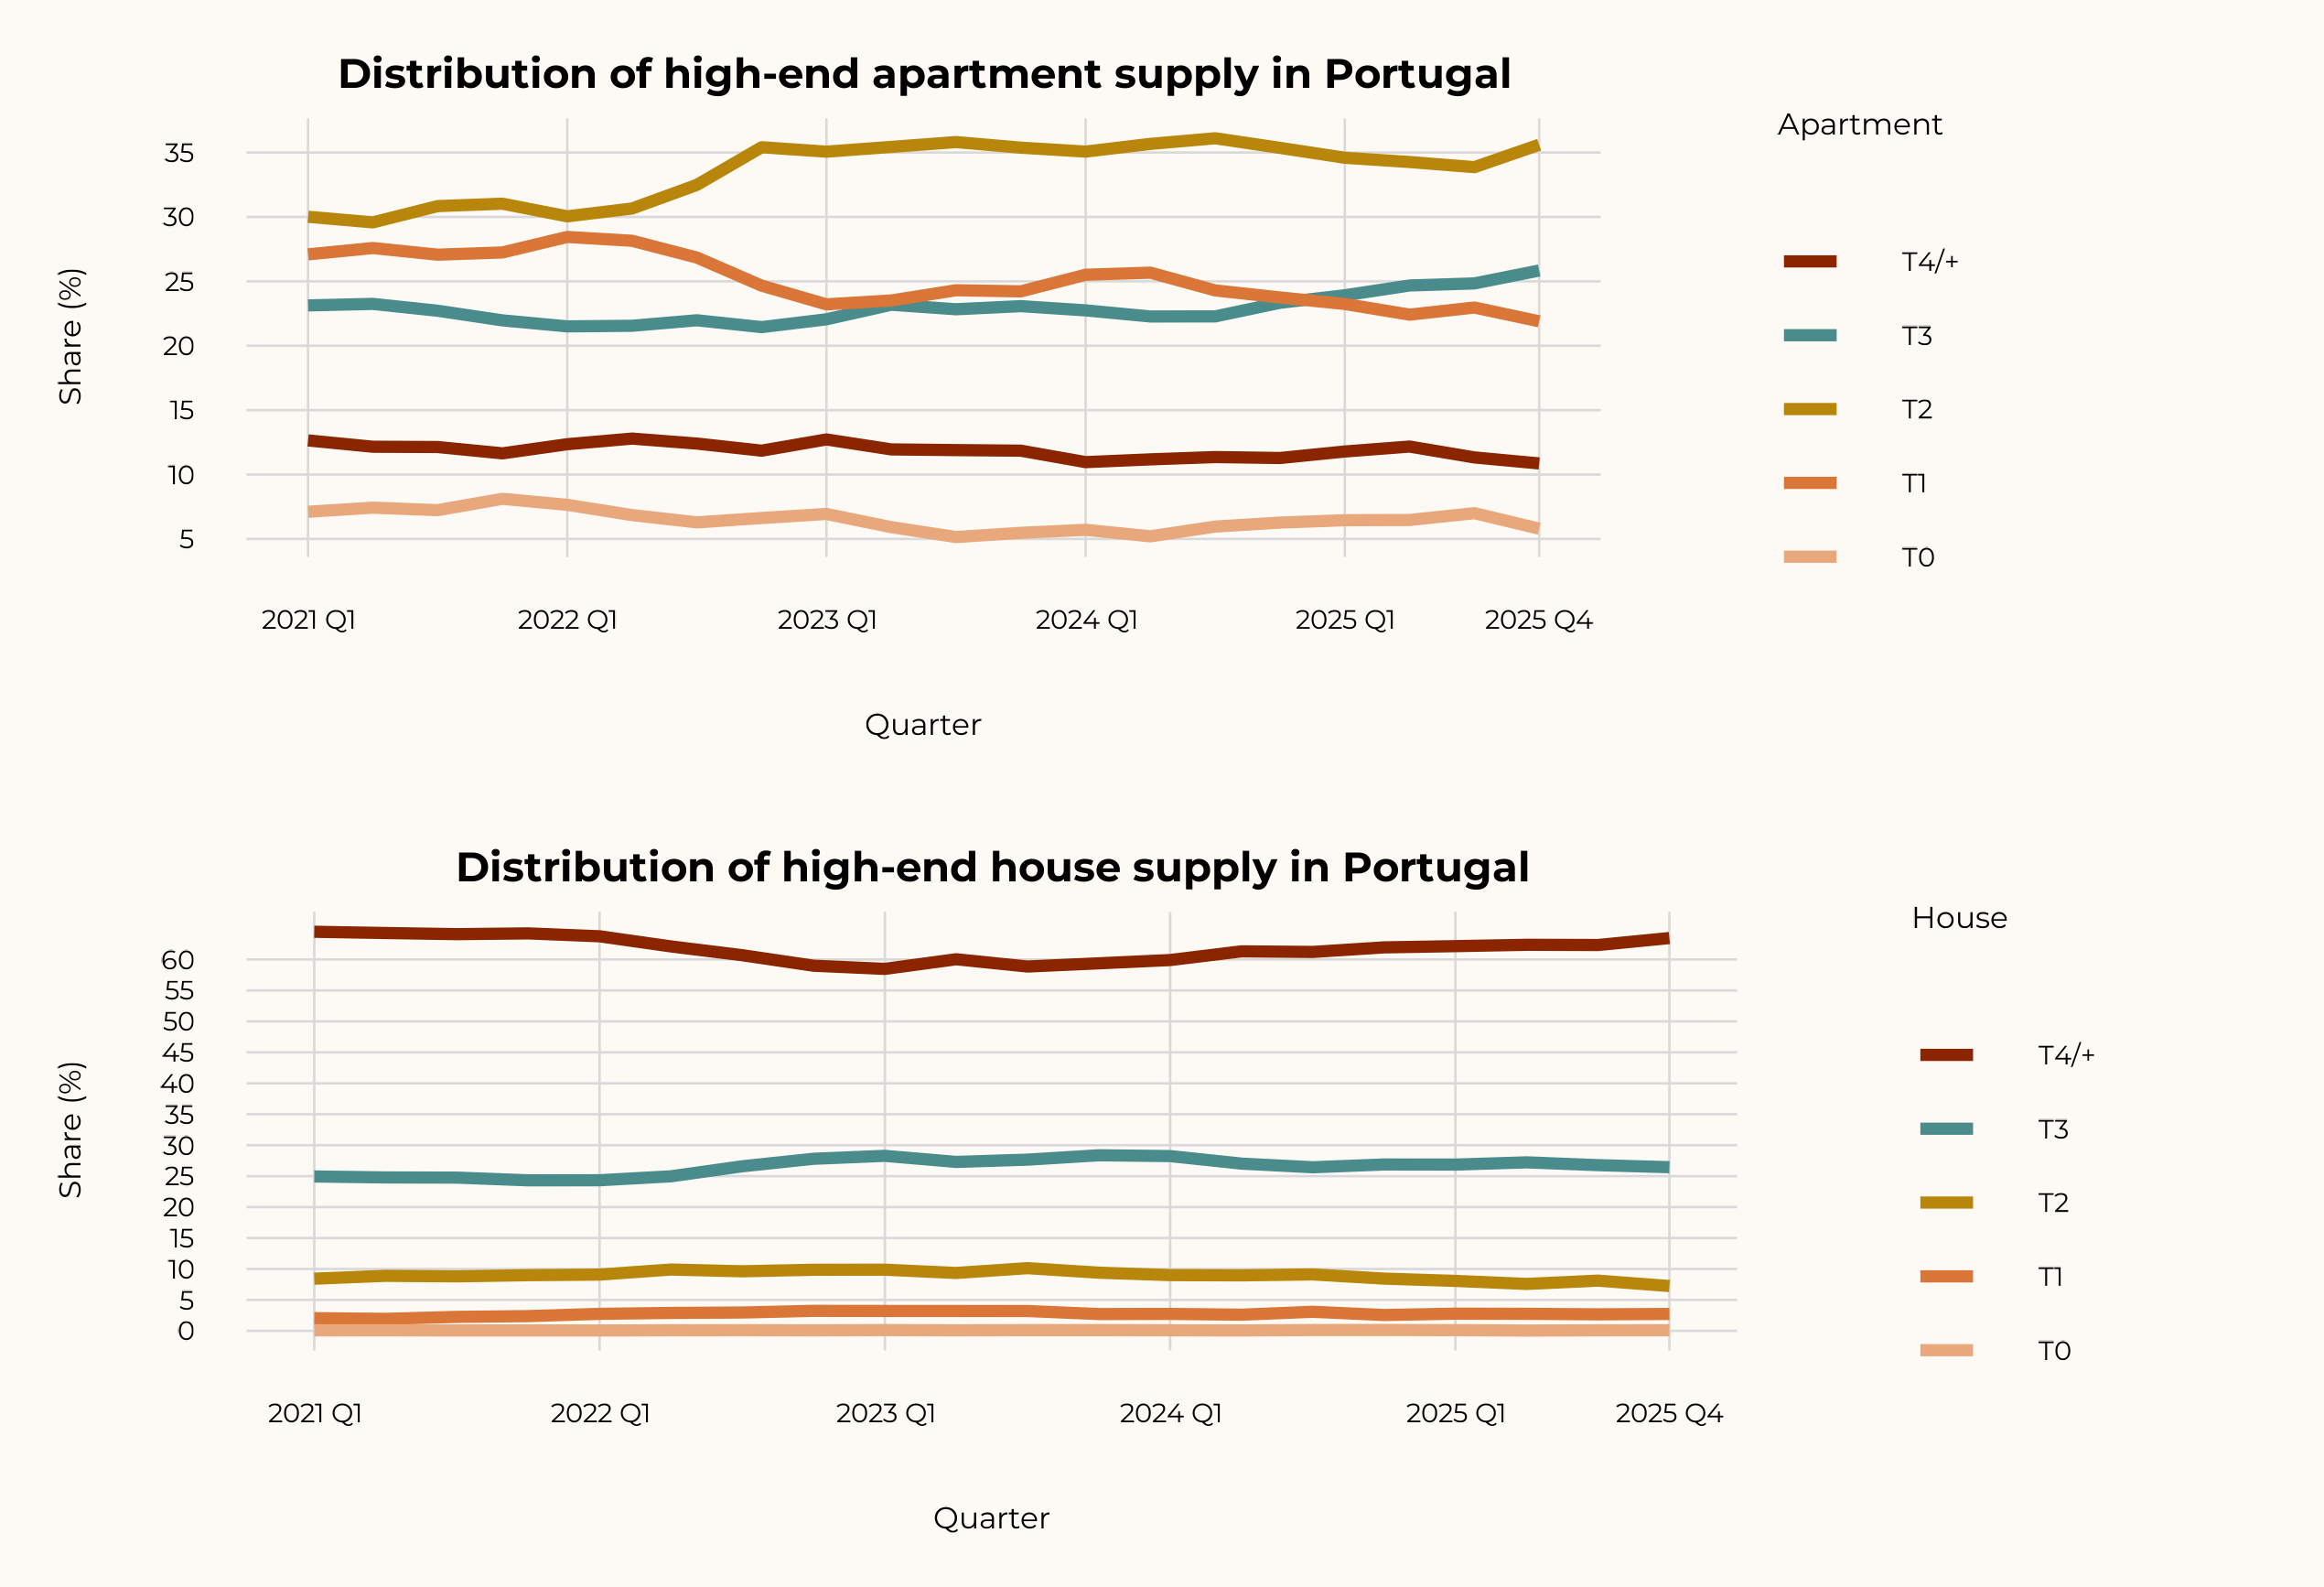
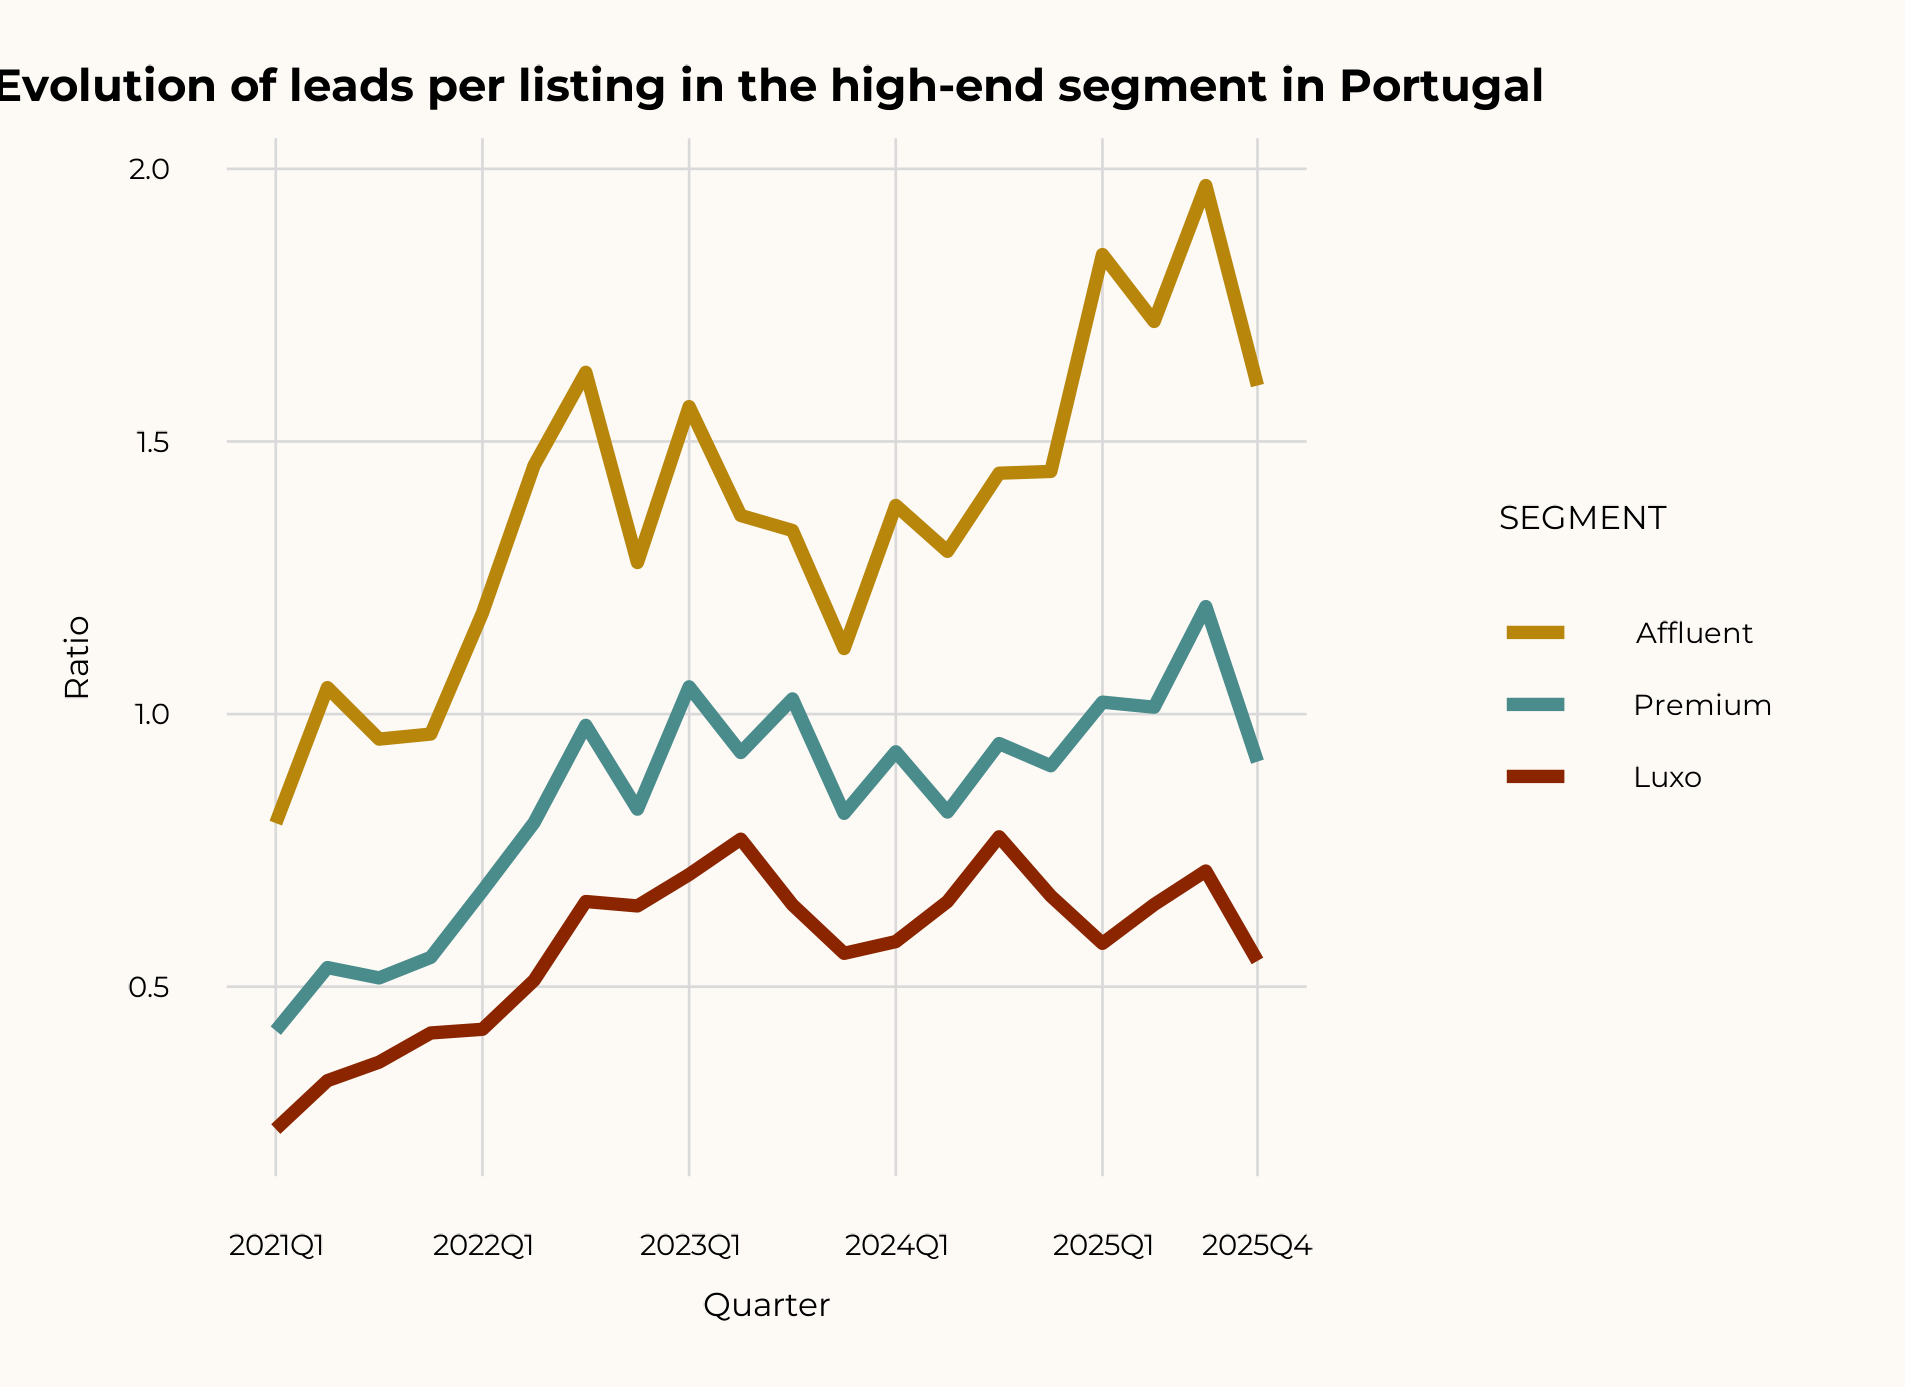
The supply contraction cuts across all three high-end segments
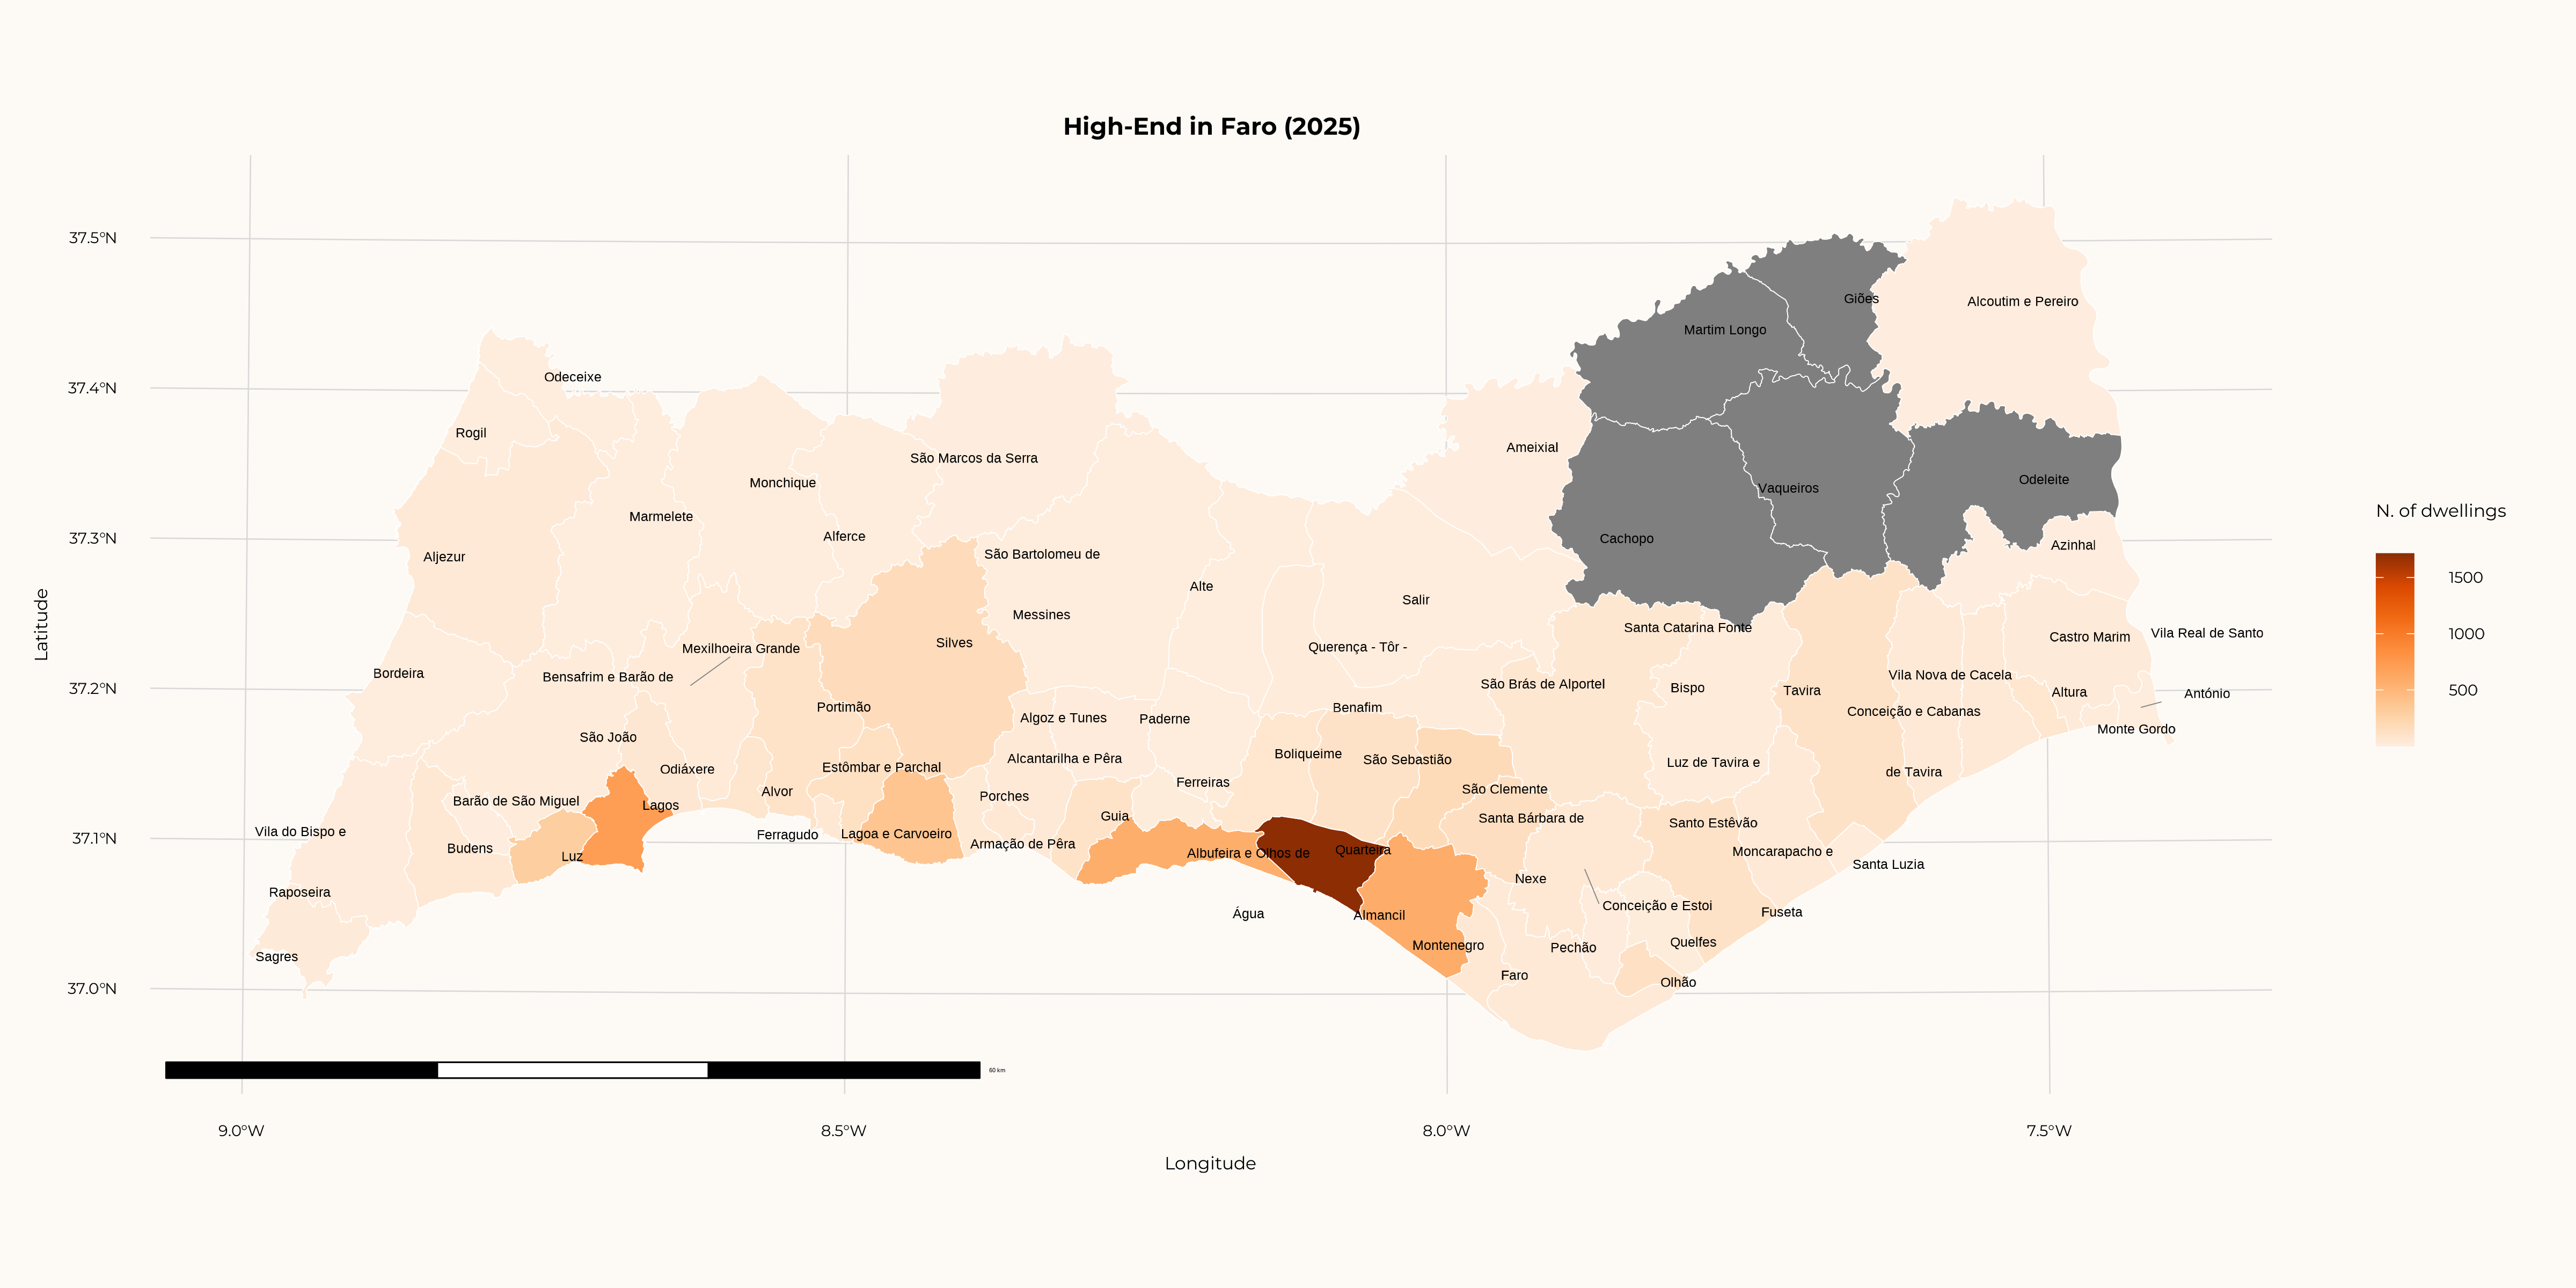
Lisboa, Faro and Porto account for the vast majority of high-end supply
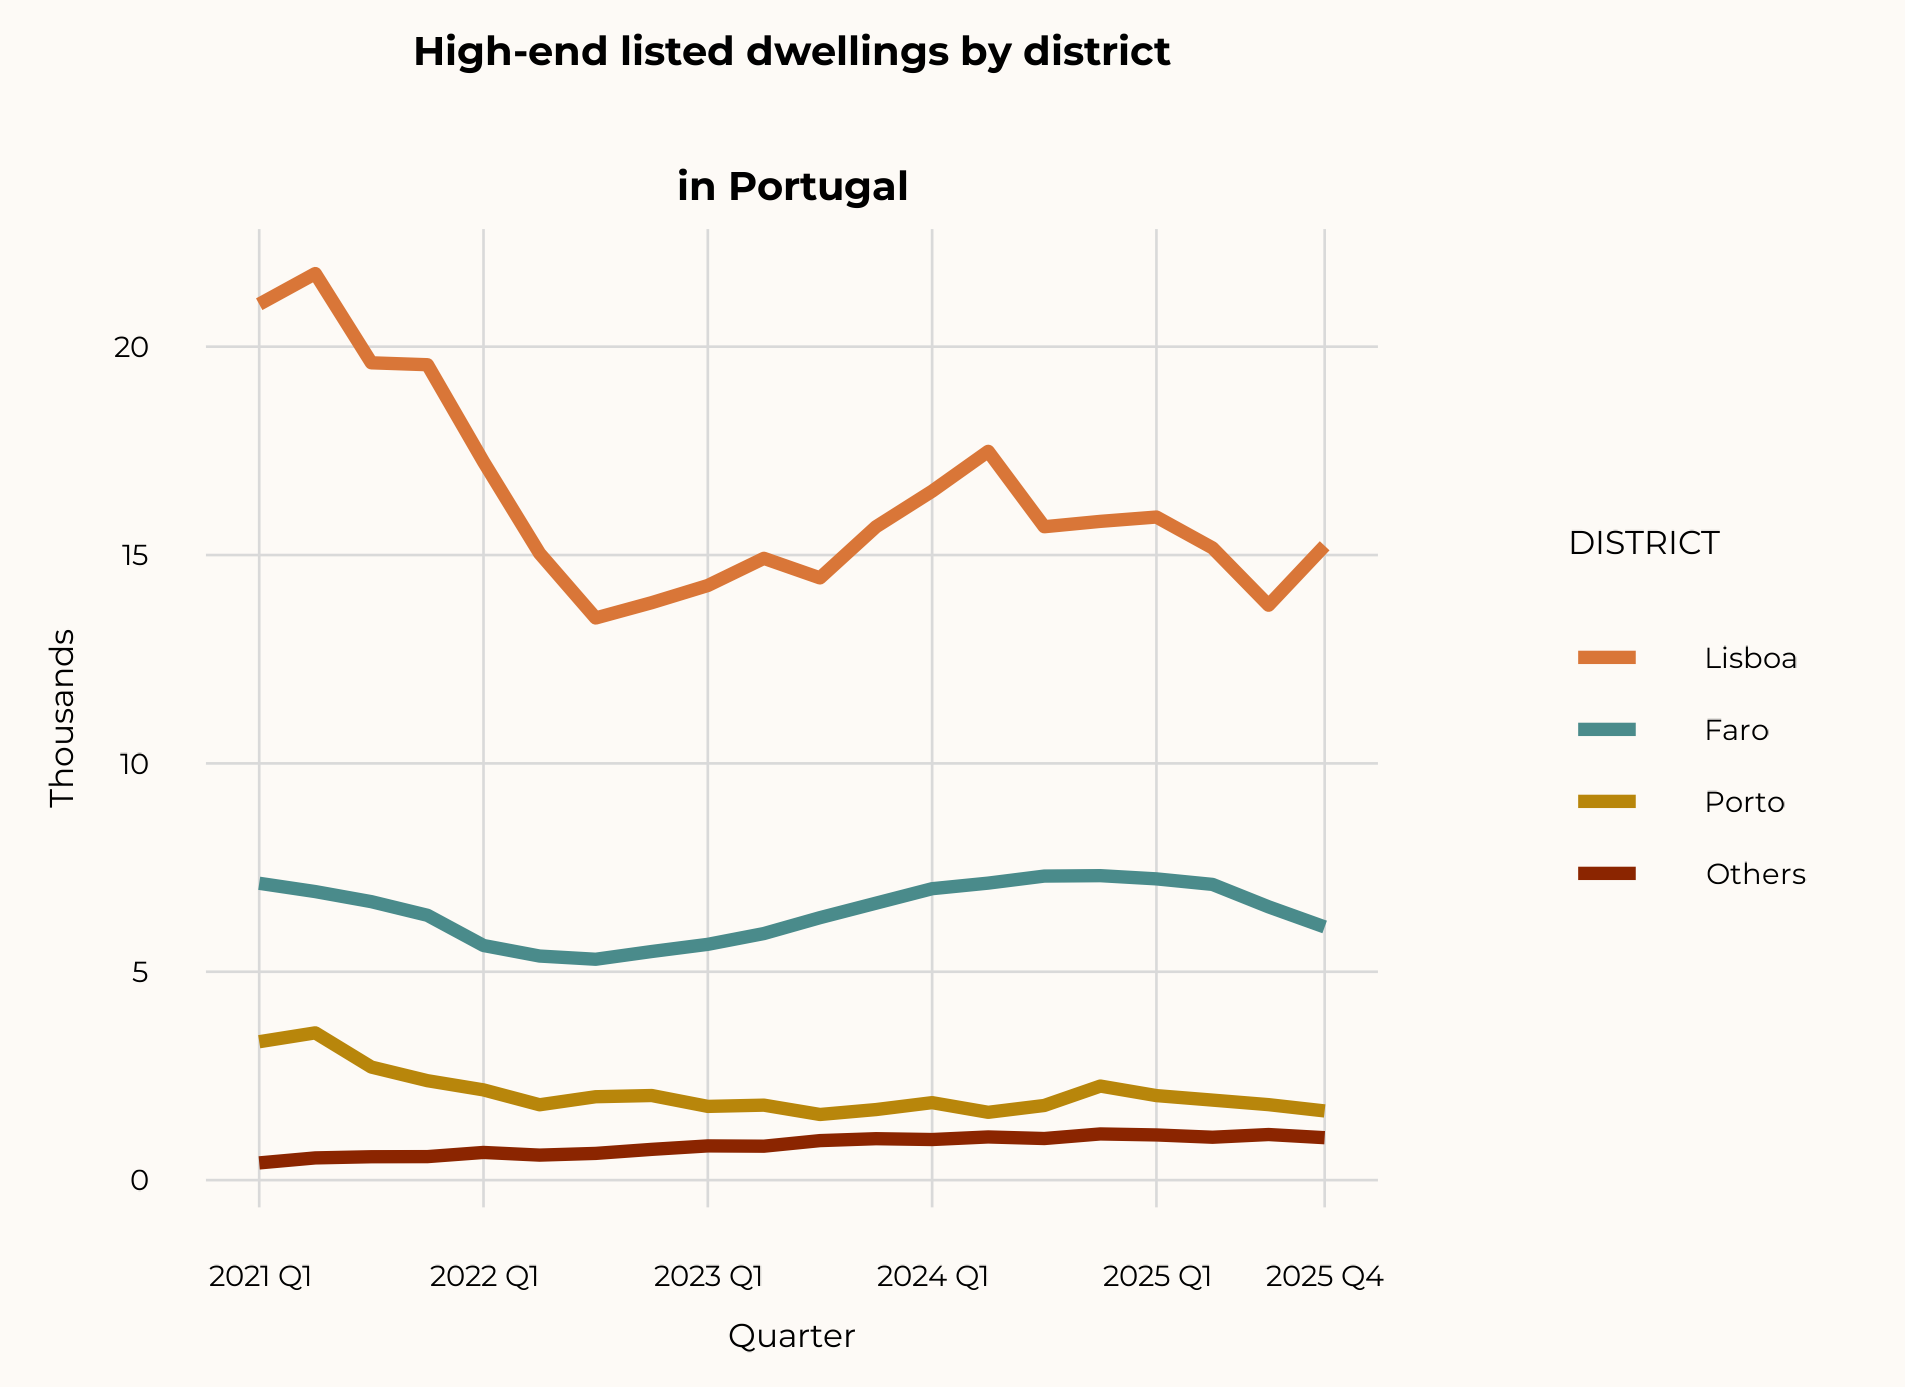
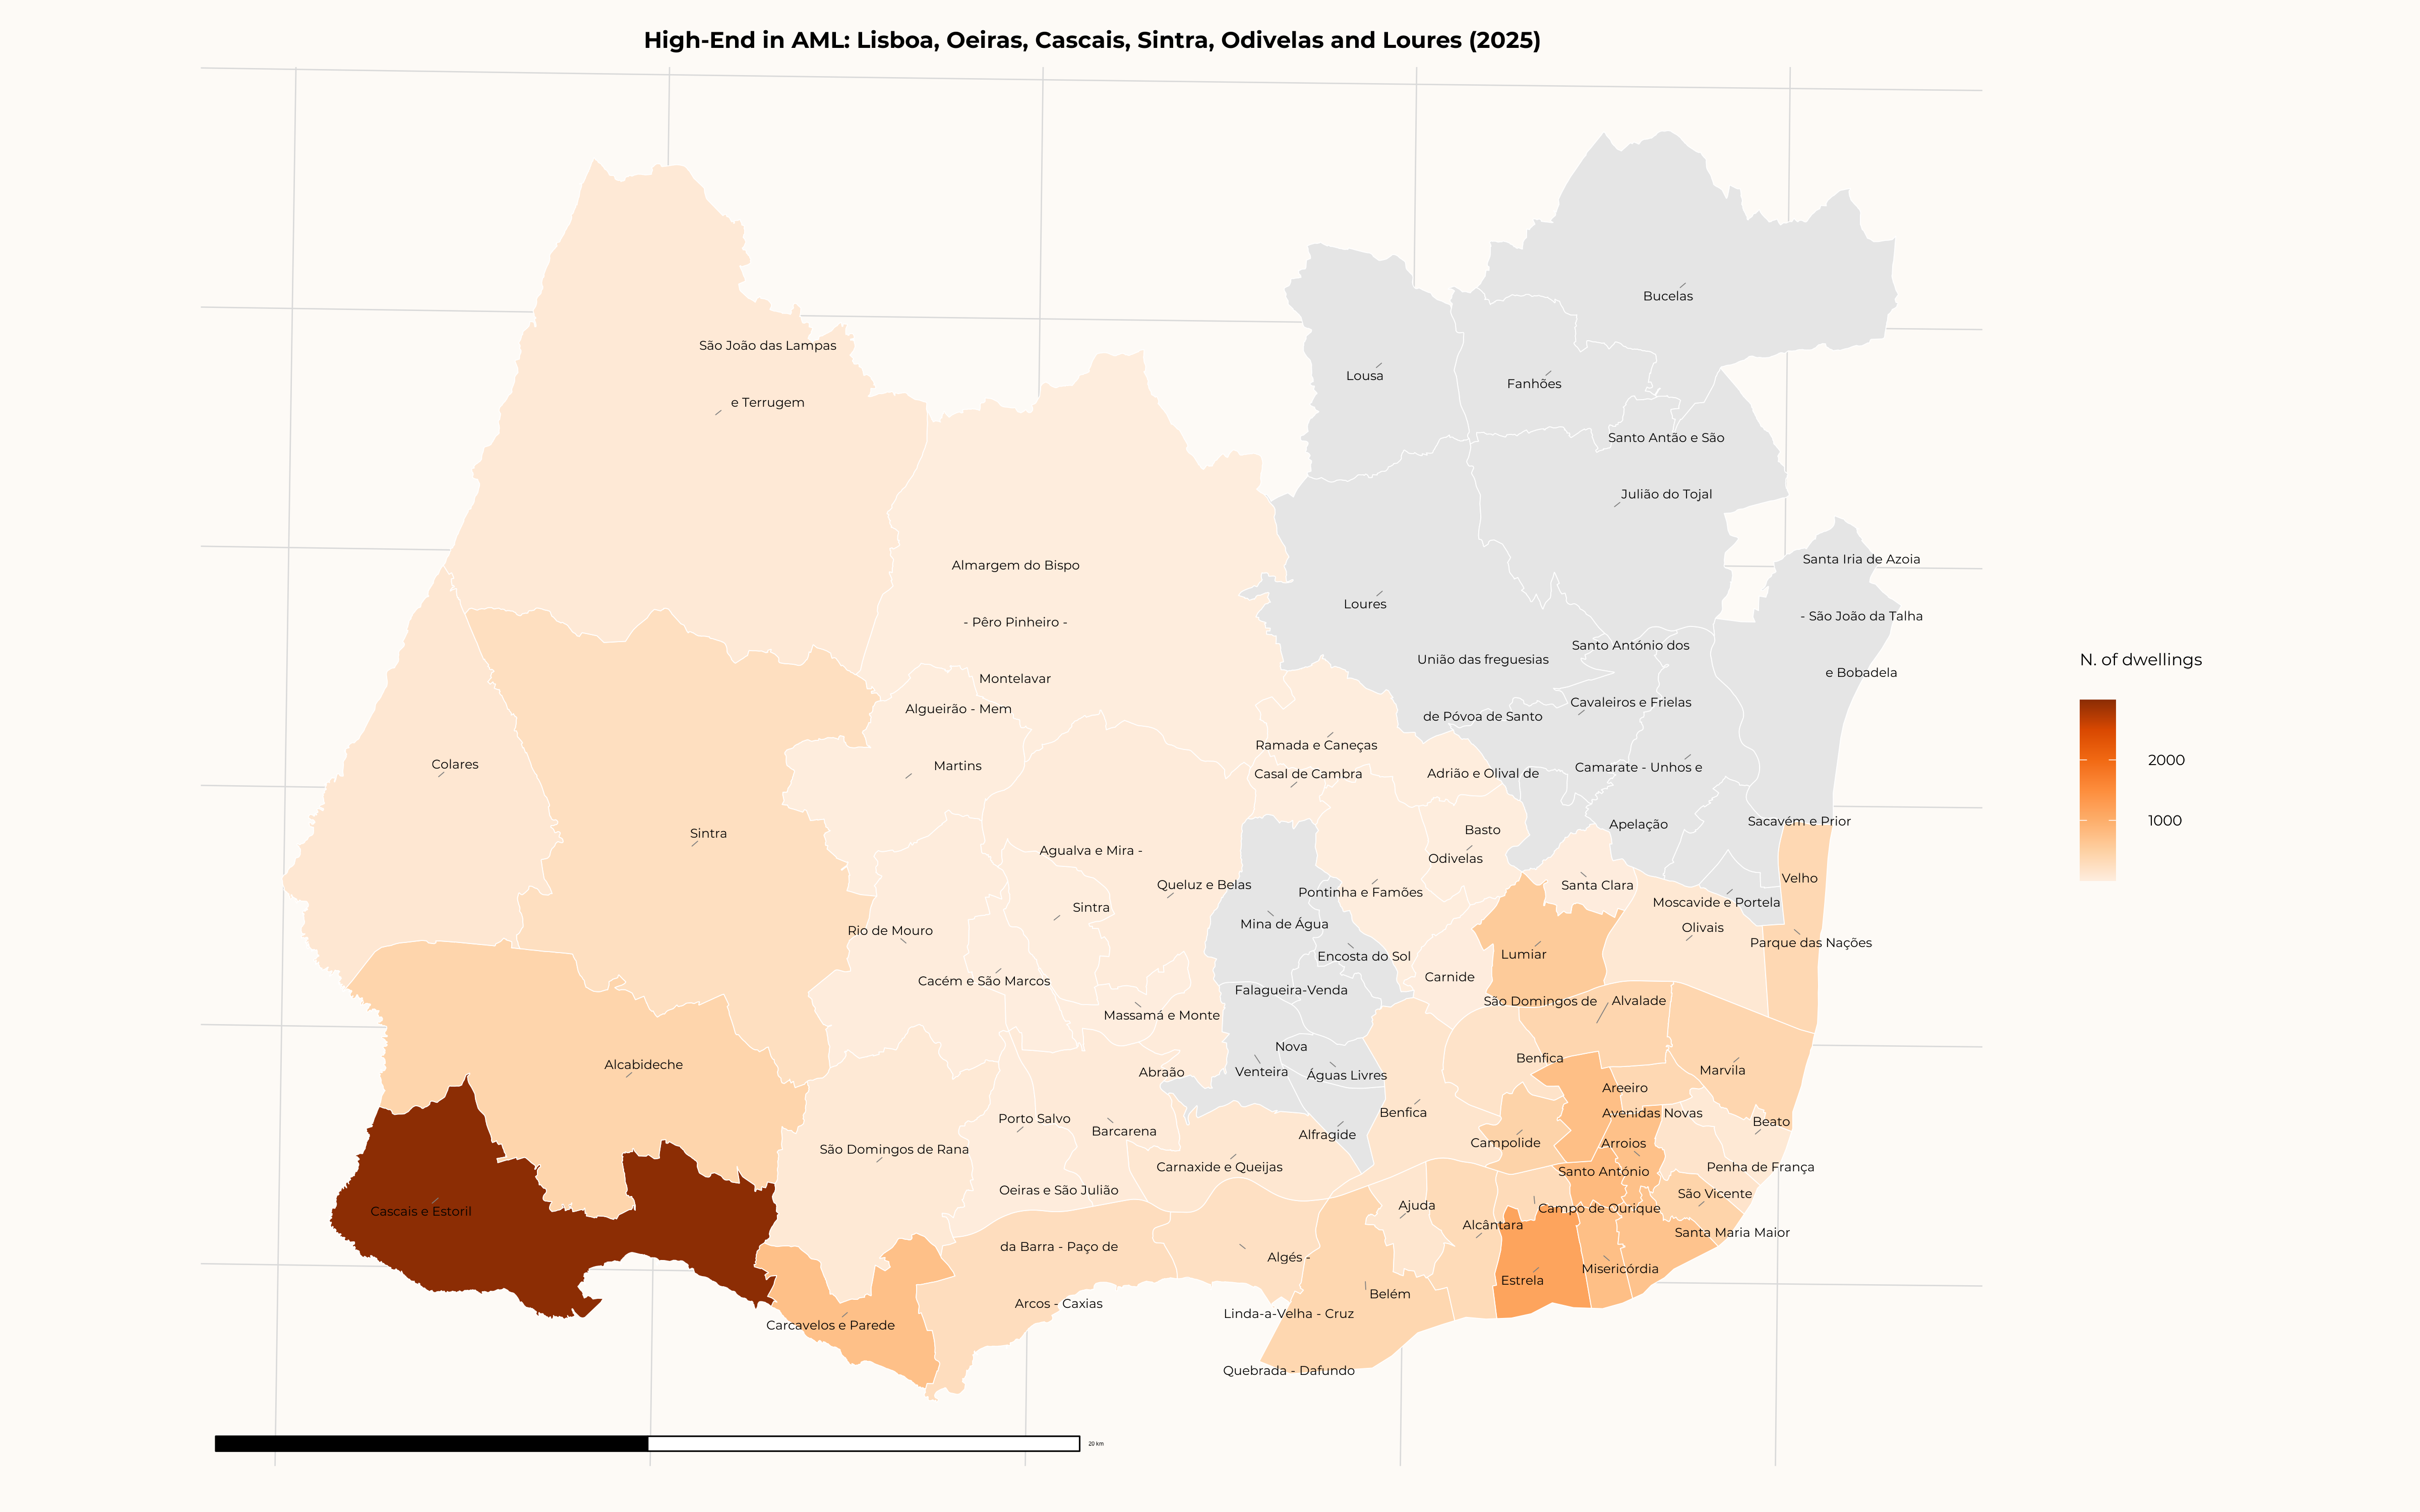
Only 7,300 apartments and 13,700 luxury houses remain available
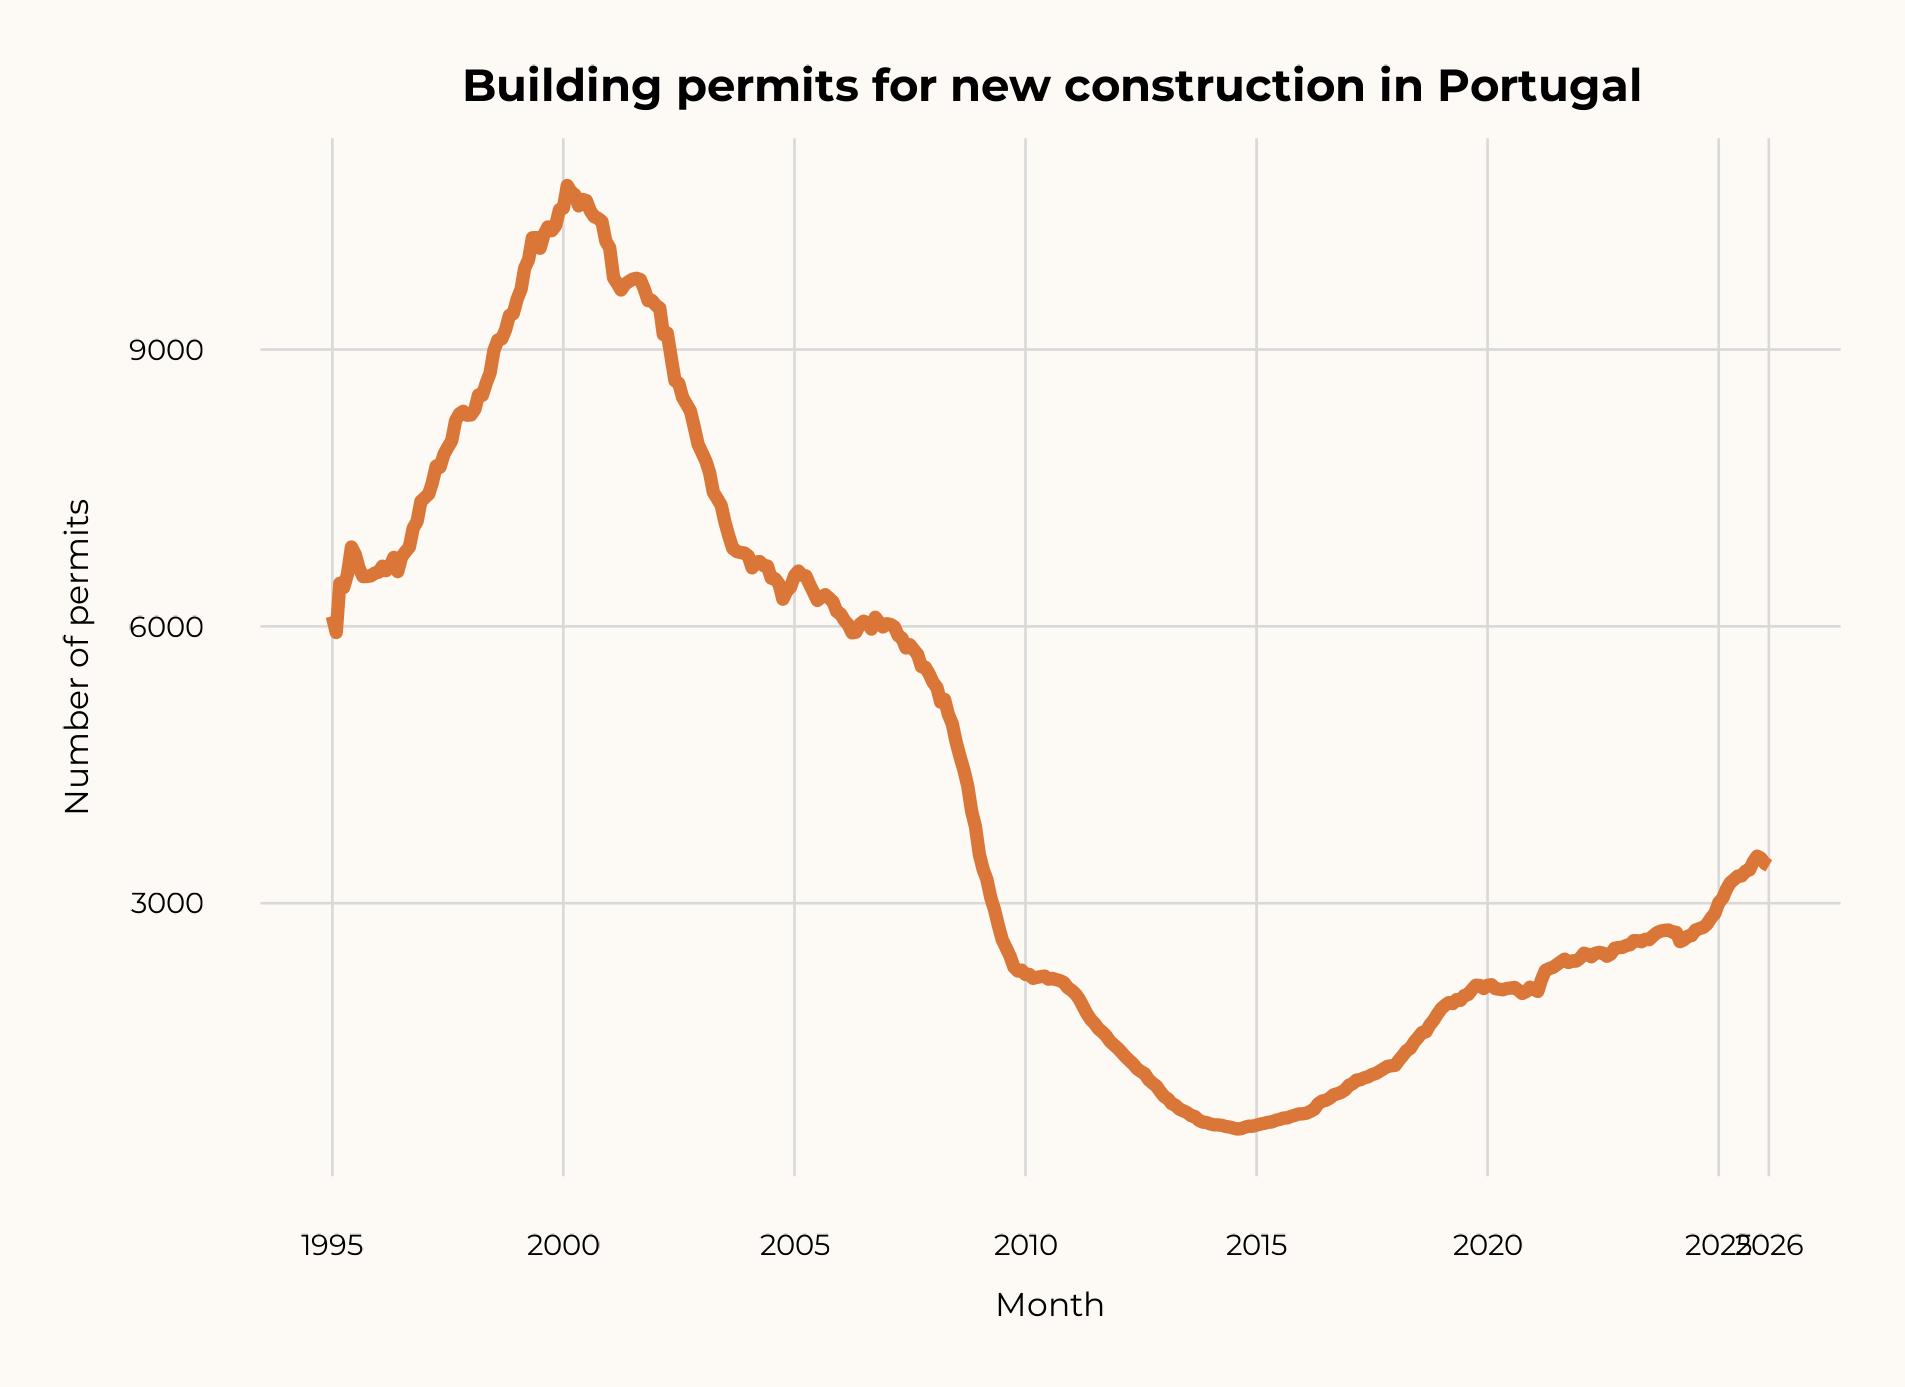
Permits have risen, but the pace of construction remains far below what is needed
After a decade of underinvestment in new housing, permits have recovered — but completions remain far short of the minimum required to replenish the housing stock. In 2024, only about 25,000 dwellings were completed, less than half the 70,000/year threshold considered indispensable. The accumulated deficit is estimated at 150,000 to 465,000 units.
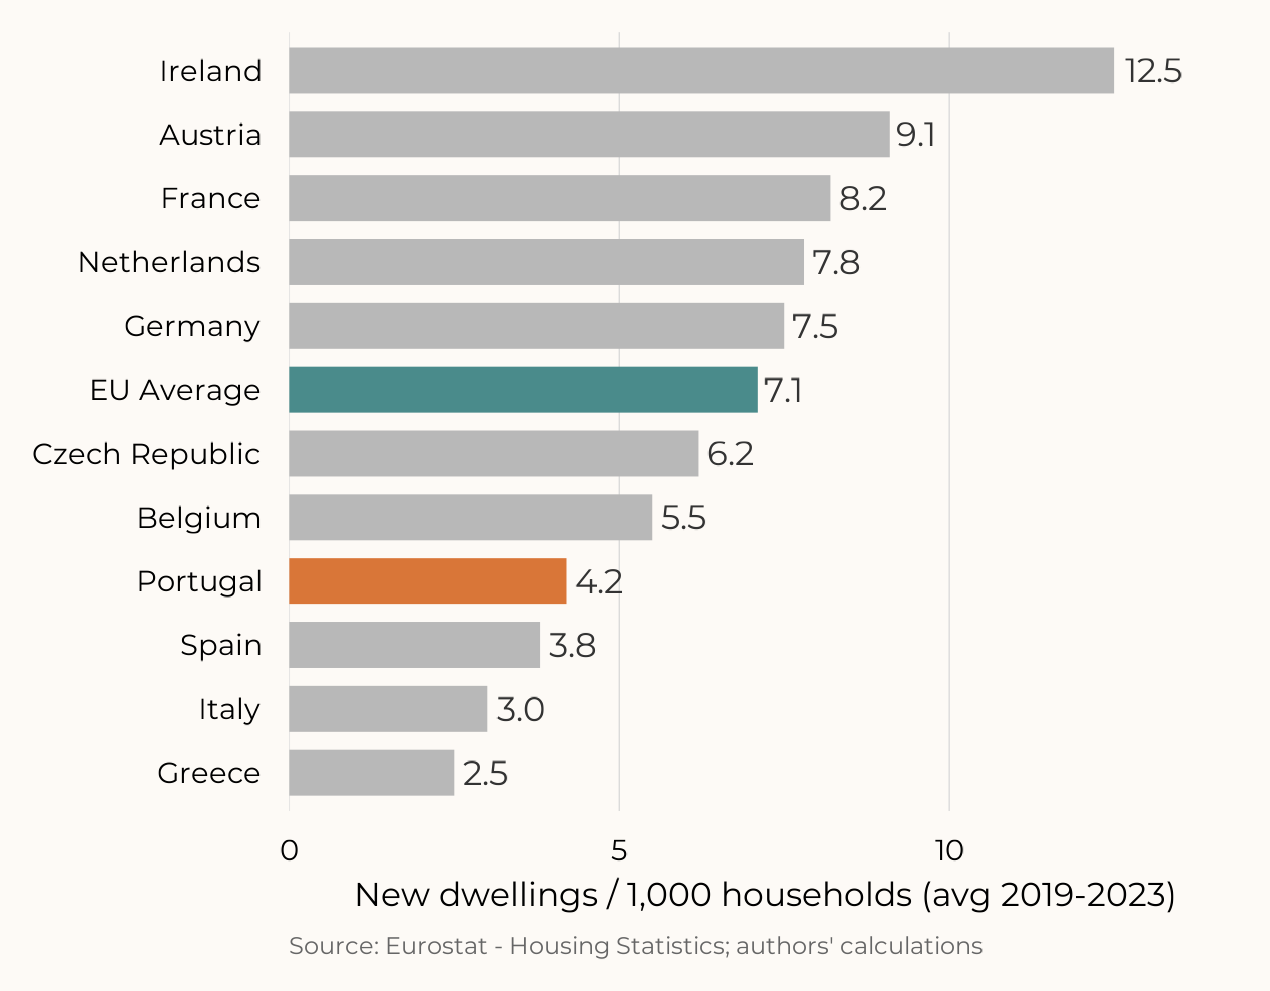
Portugal builds fewer new dwellings per household than most EU countries
When normalized by the number of households, residential construction in Portugal ranks among the lowest in Western Europe. Over the 2019–2023 average, Portugal built 4.2 new dwellings per 1,000 households, versus an EU average of 7.1 and values of 8.2 (France), 7.5 (Germany) and 12.5 (Ireland). Only Greece, Italy and Spain fall below Portugal.
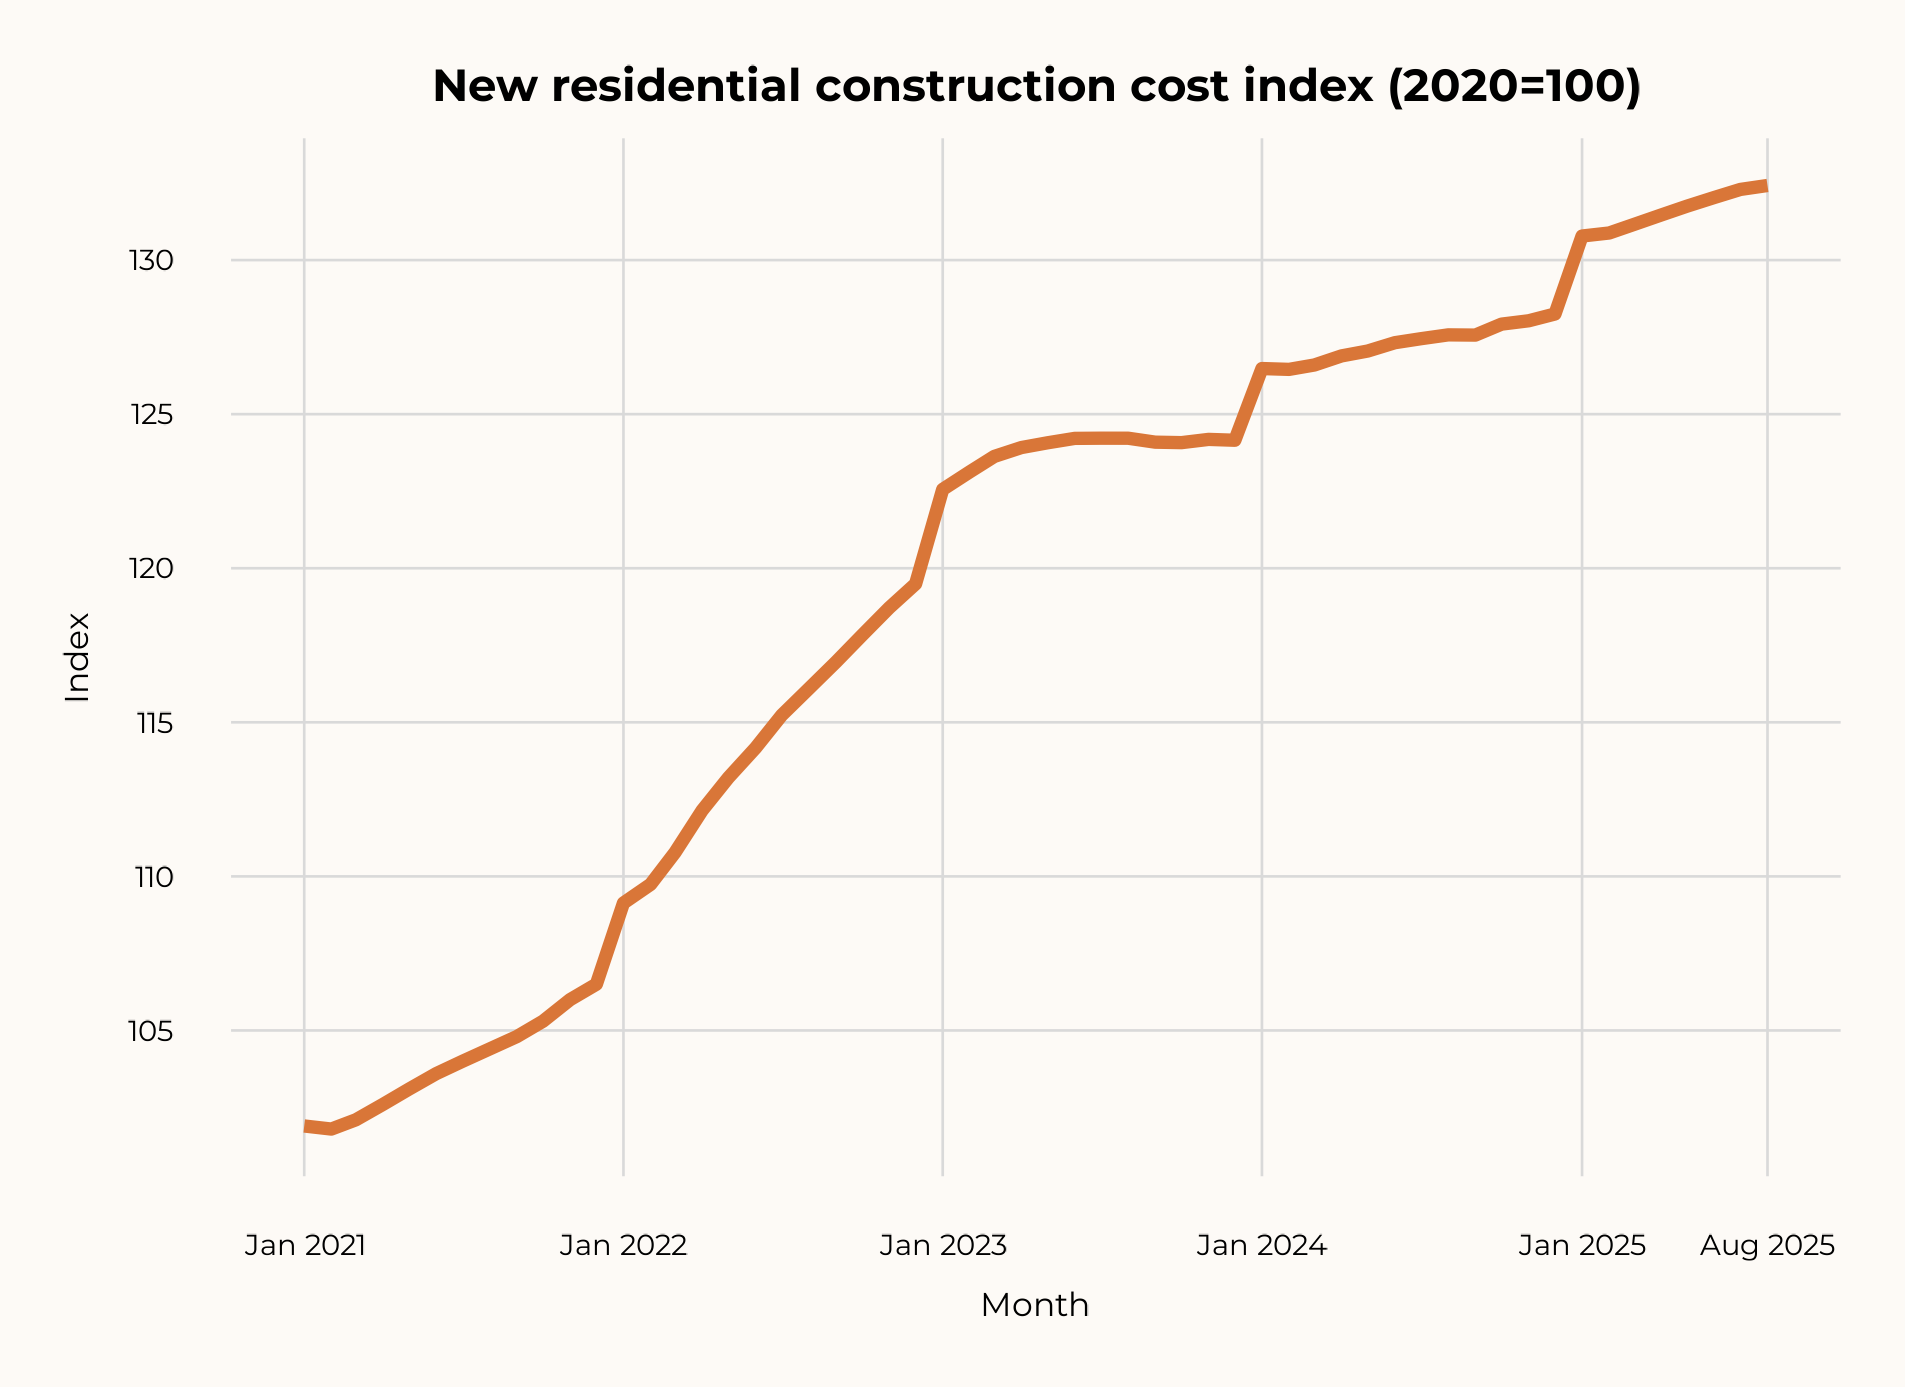
Construction costs surged: first materials, then labor
The cost escalation had two sequential drivers. The materials phase (2021–2022) stemmed from post-COVID supply-chain disruption and the war in Ukraine — steel rose +35%, concrete +18%, and total materials costs accumulated +32%. The labor phase (2023–2025) followed from minimum wage increases of +31% (€635 → €870) and worker shortages; labor now accounts for 40–50% of total construction costs.
Costs make it unviable to sell below €4,500–5,000/m²
The sum of costs along the development chain places the minimum sale price for new construction between €4,275 and €4,925/m² — meaning all new construction automatically enters the high-end segment. The cost structure per m² is as follows:
~50% of total
Source: AICCOPN; AT (VAT); Banco de Portugal, 2025. Gross cost per m² ÷ 0.85 = €/m² net sellable area (adjustment for basements, landscaping and finishes).
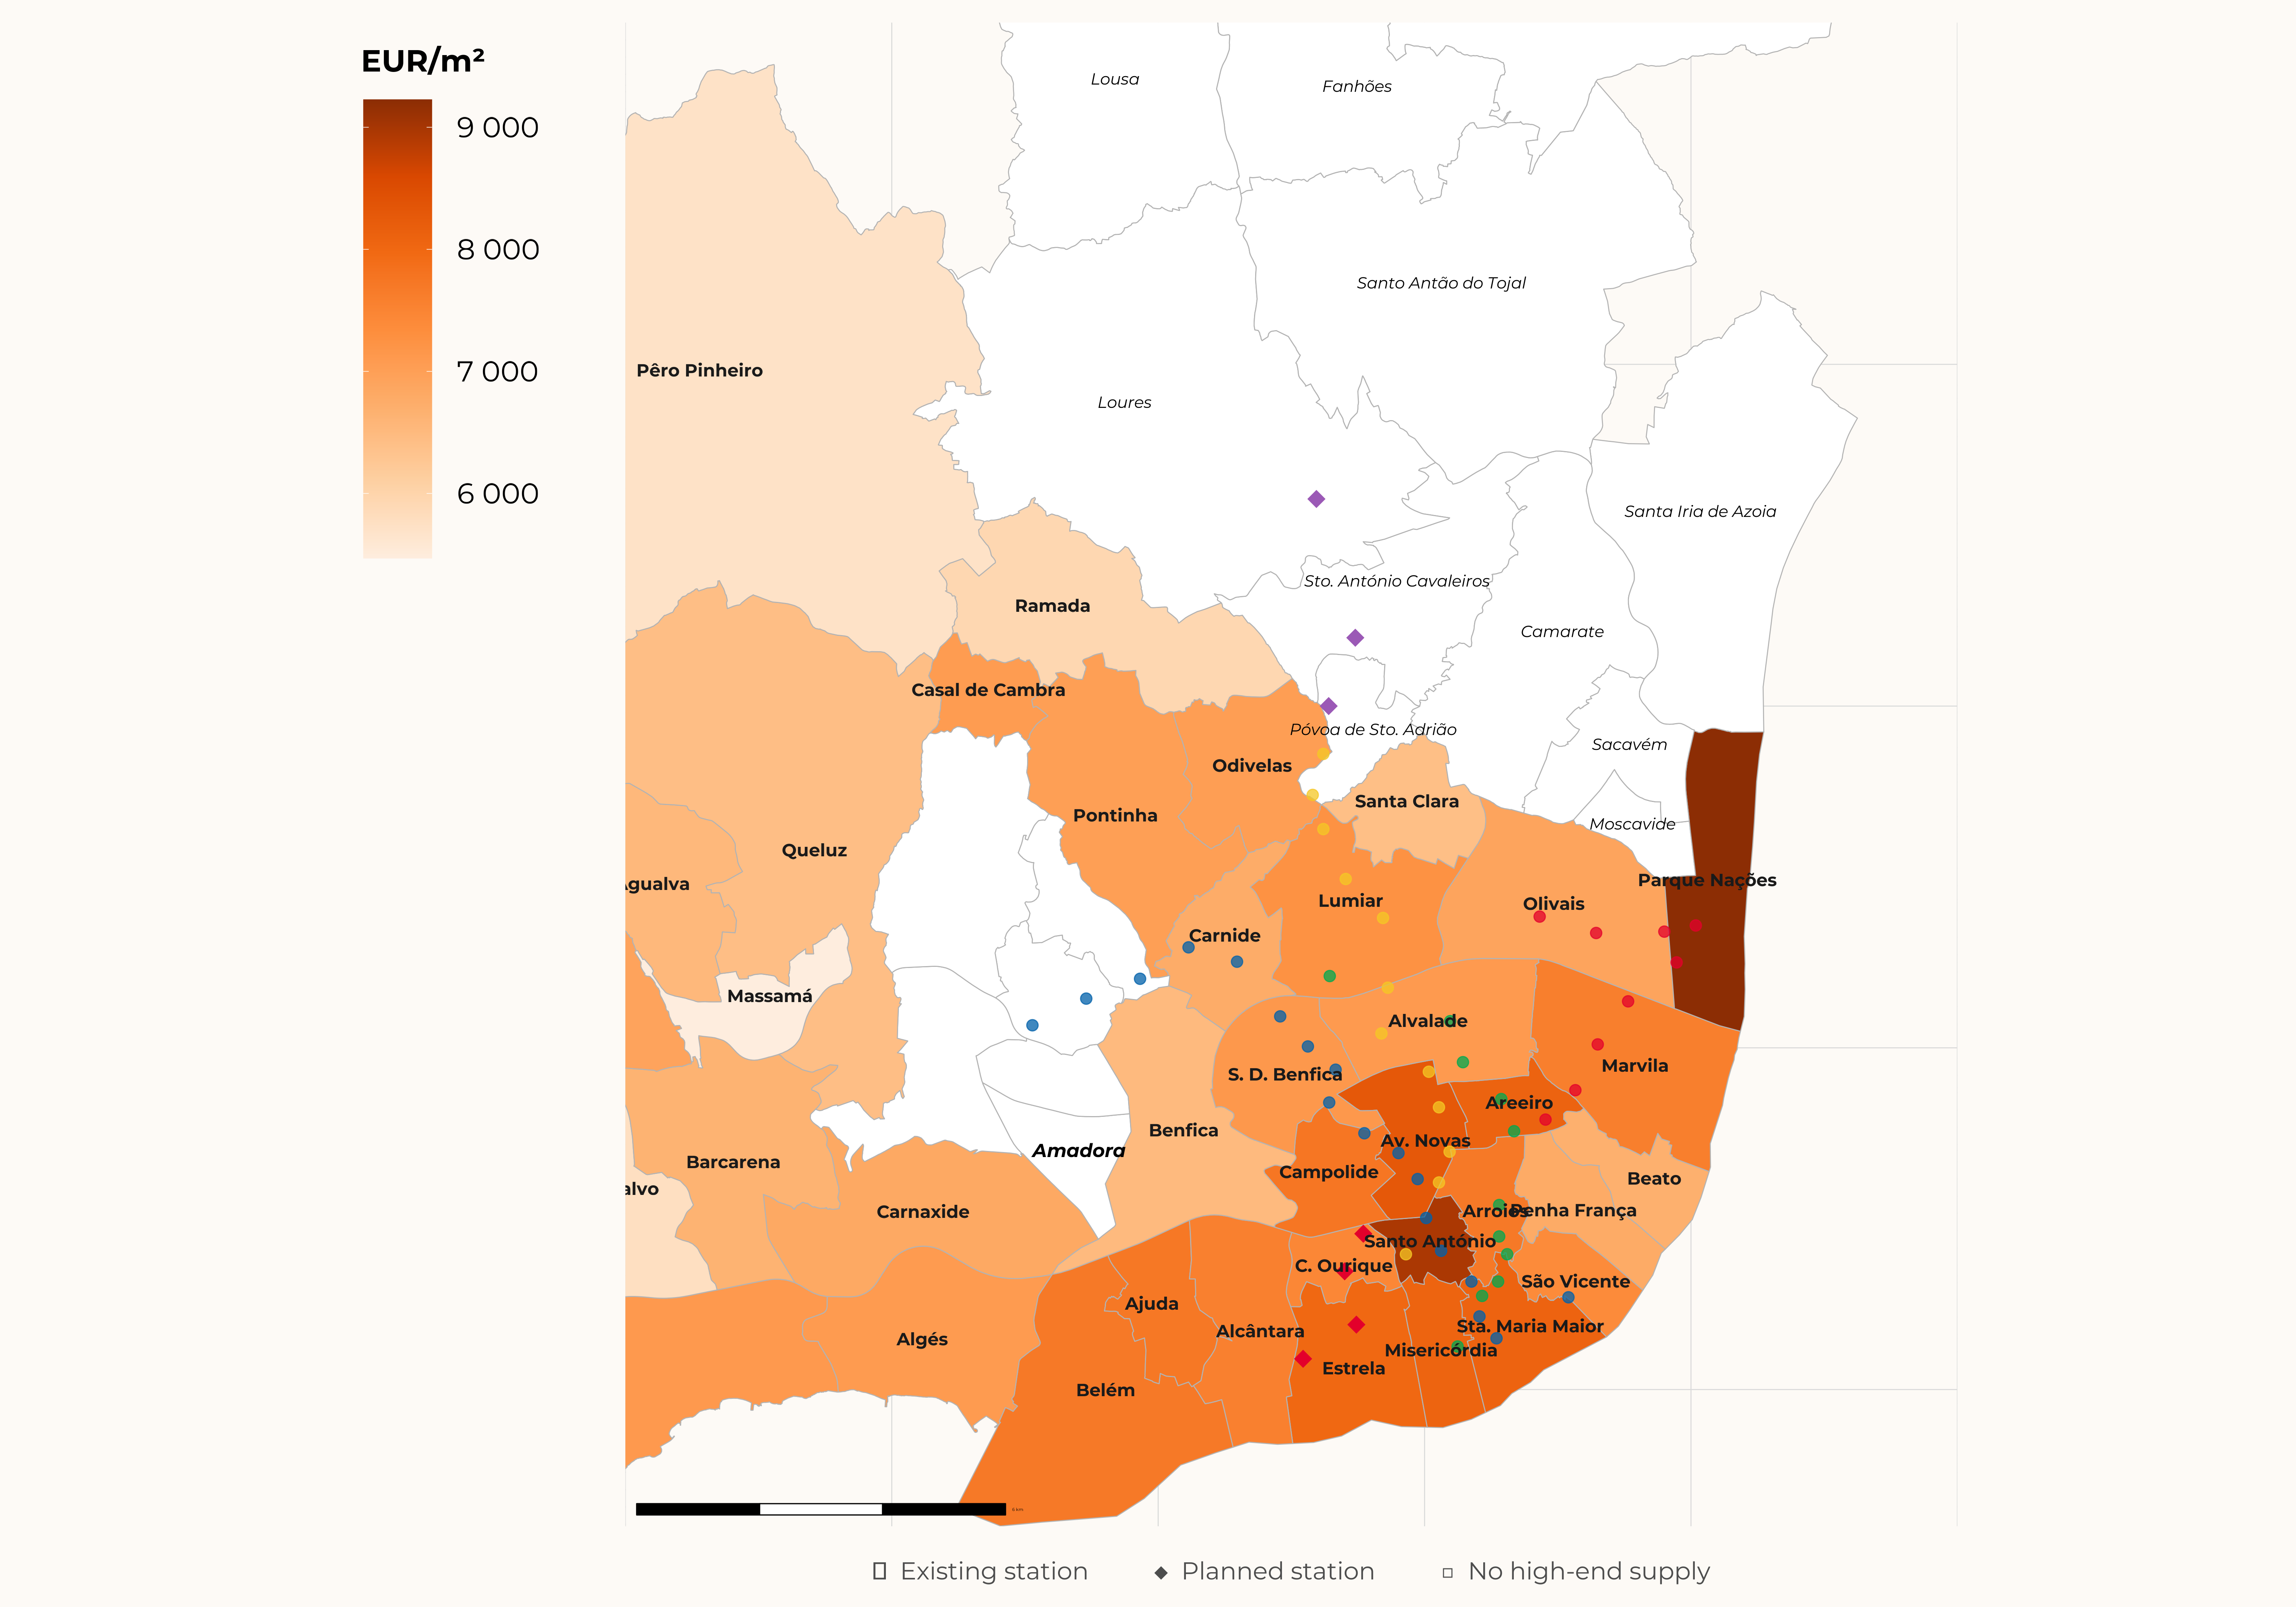
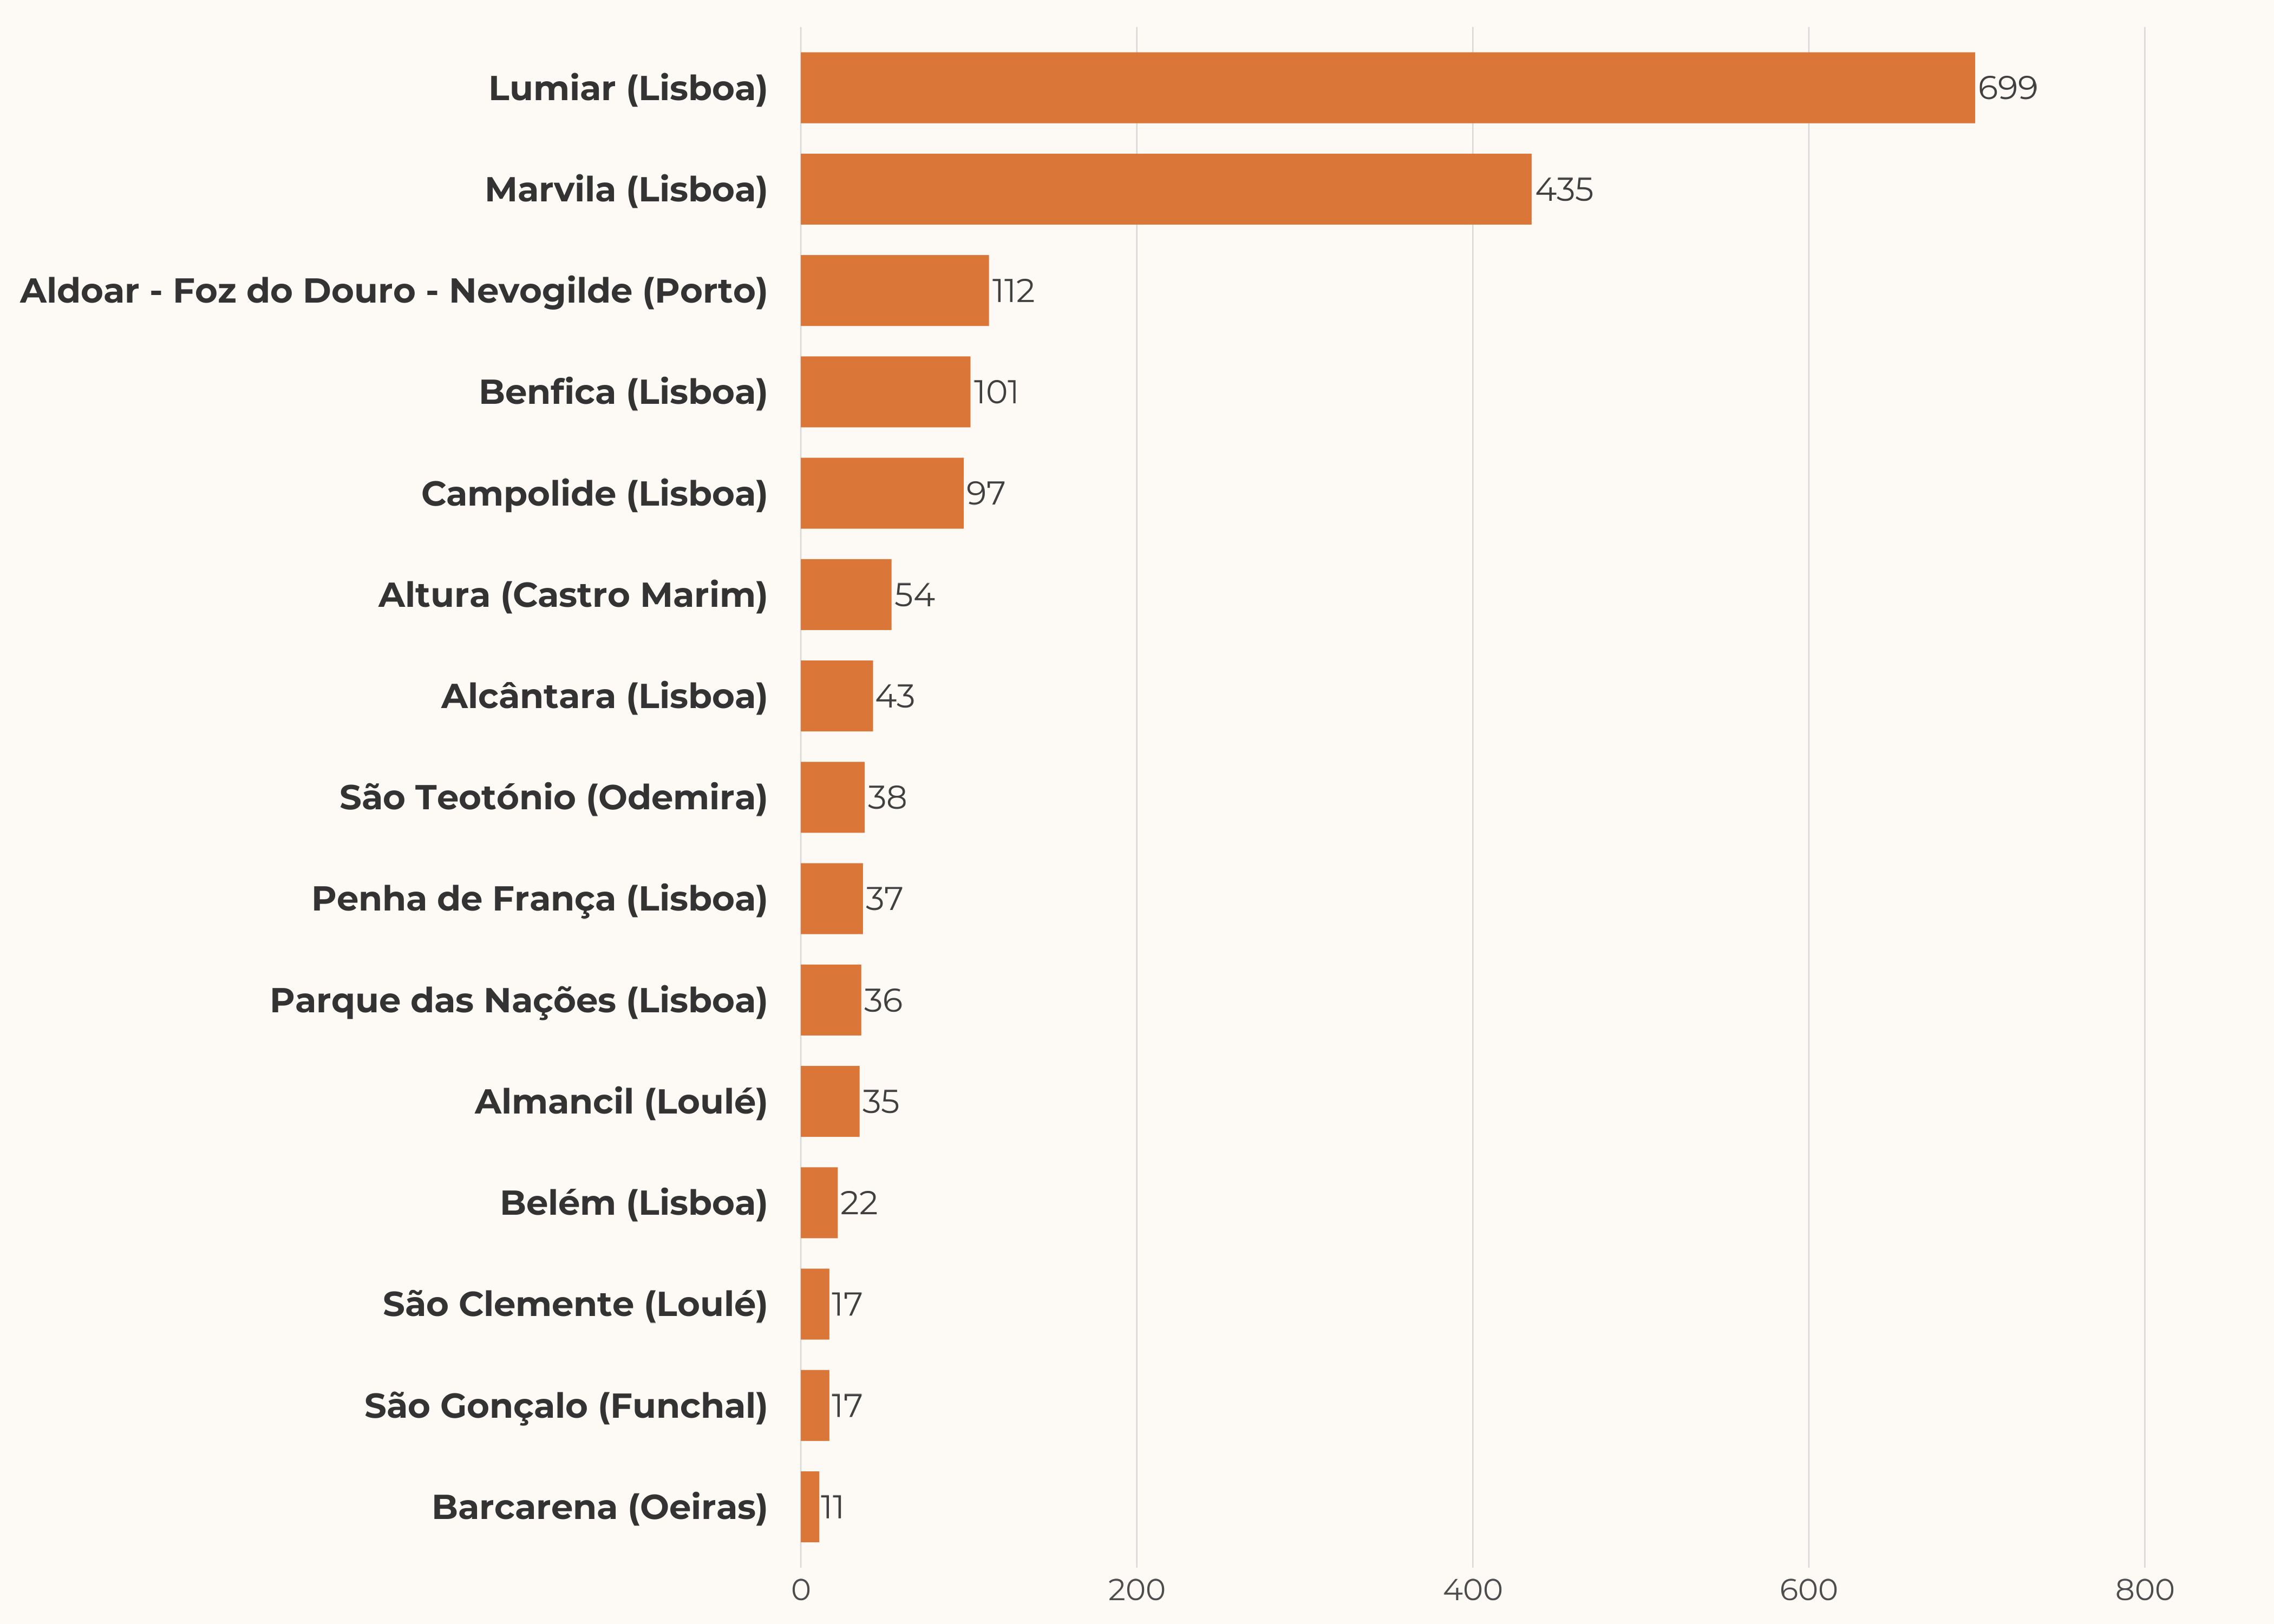
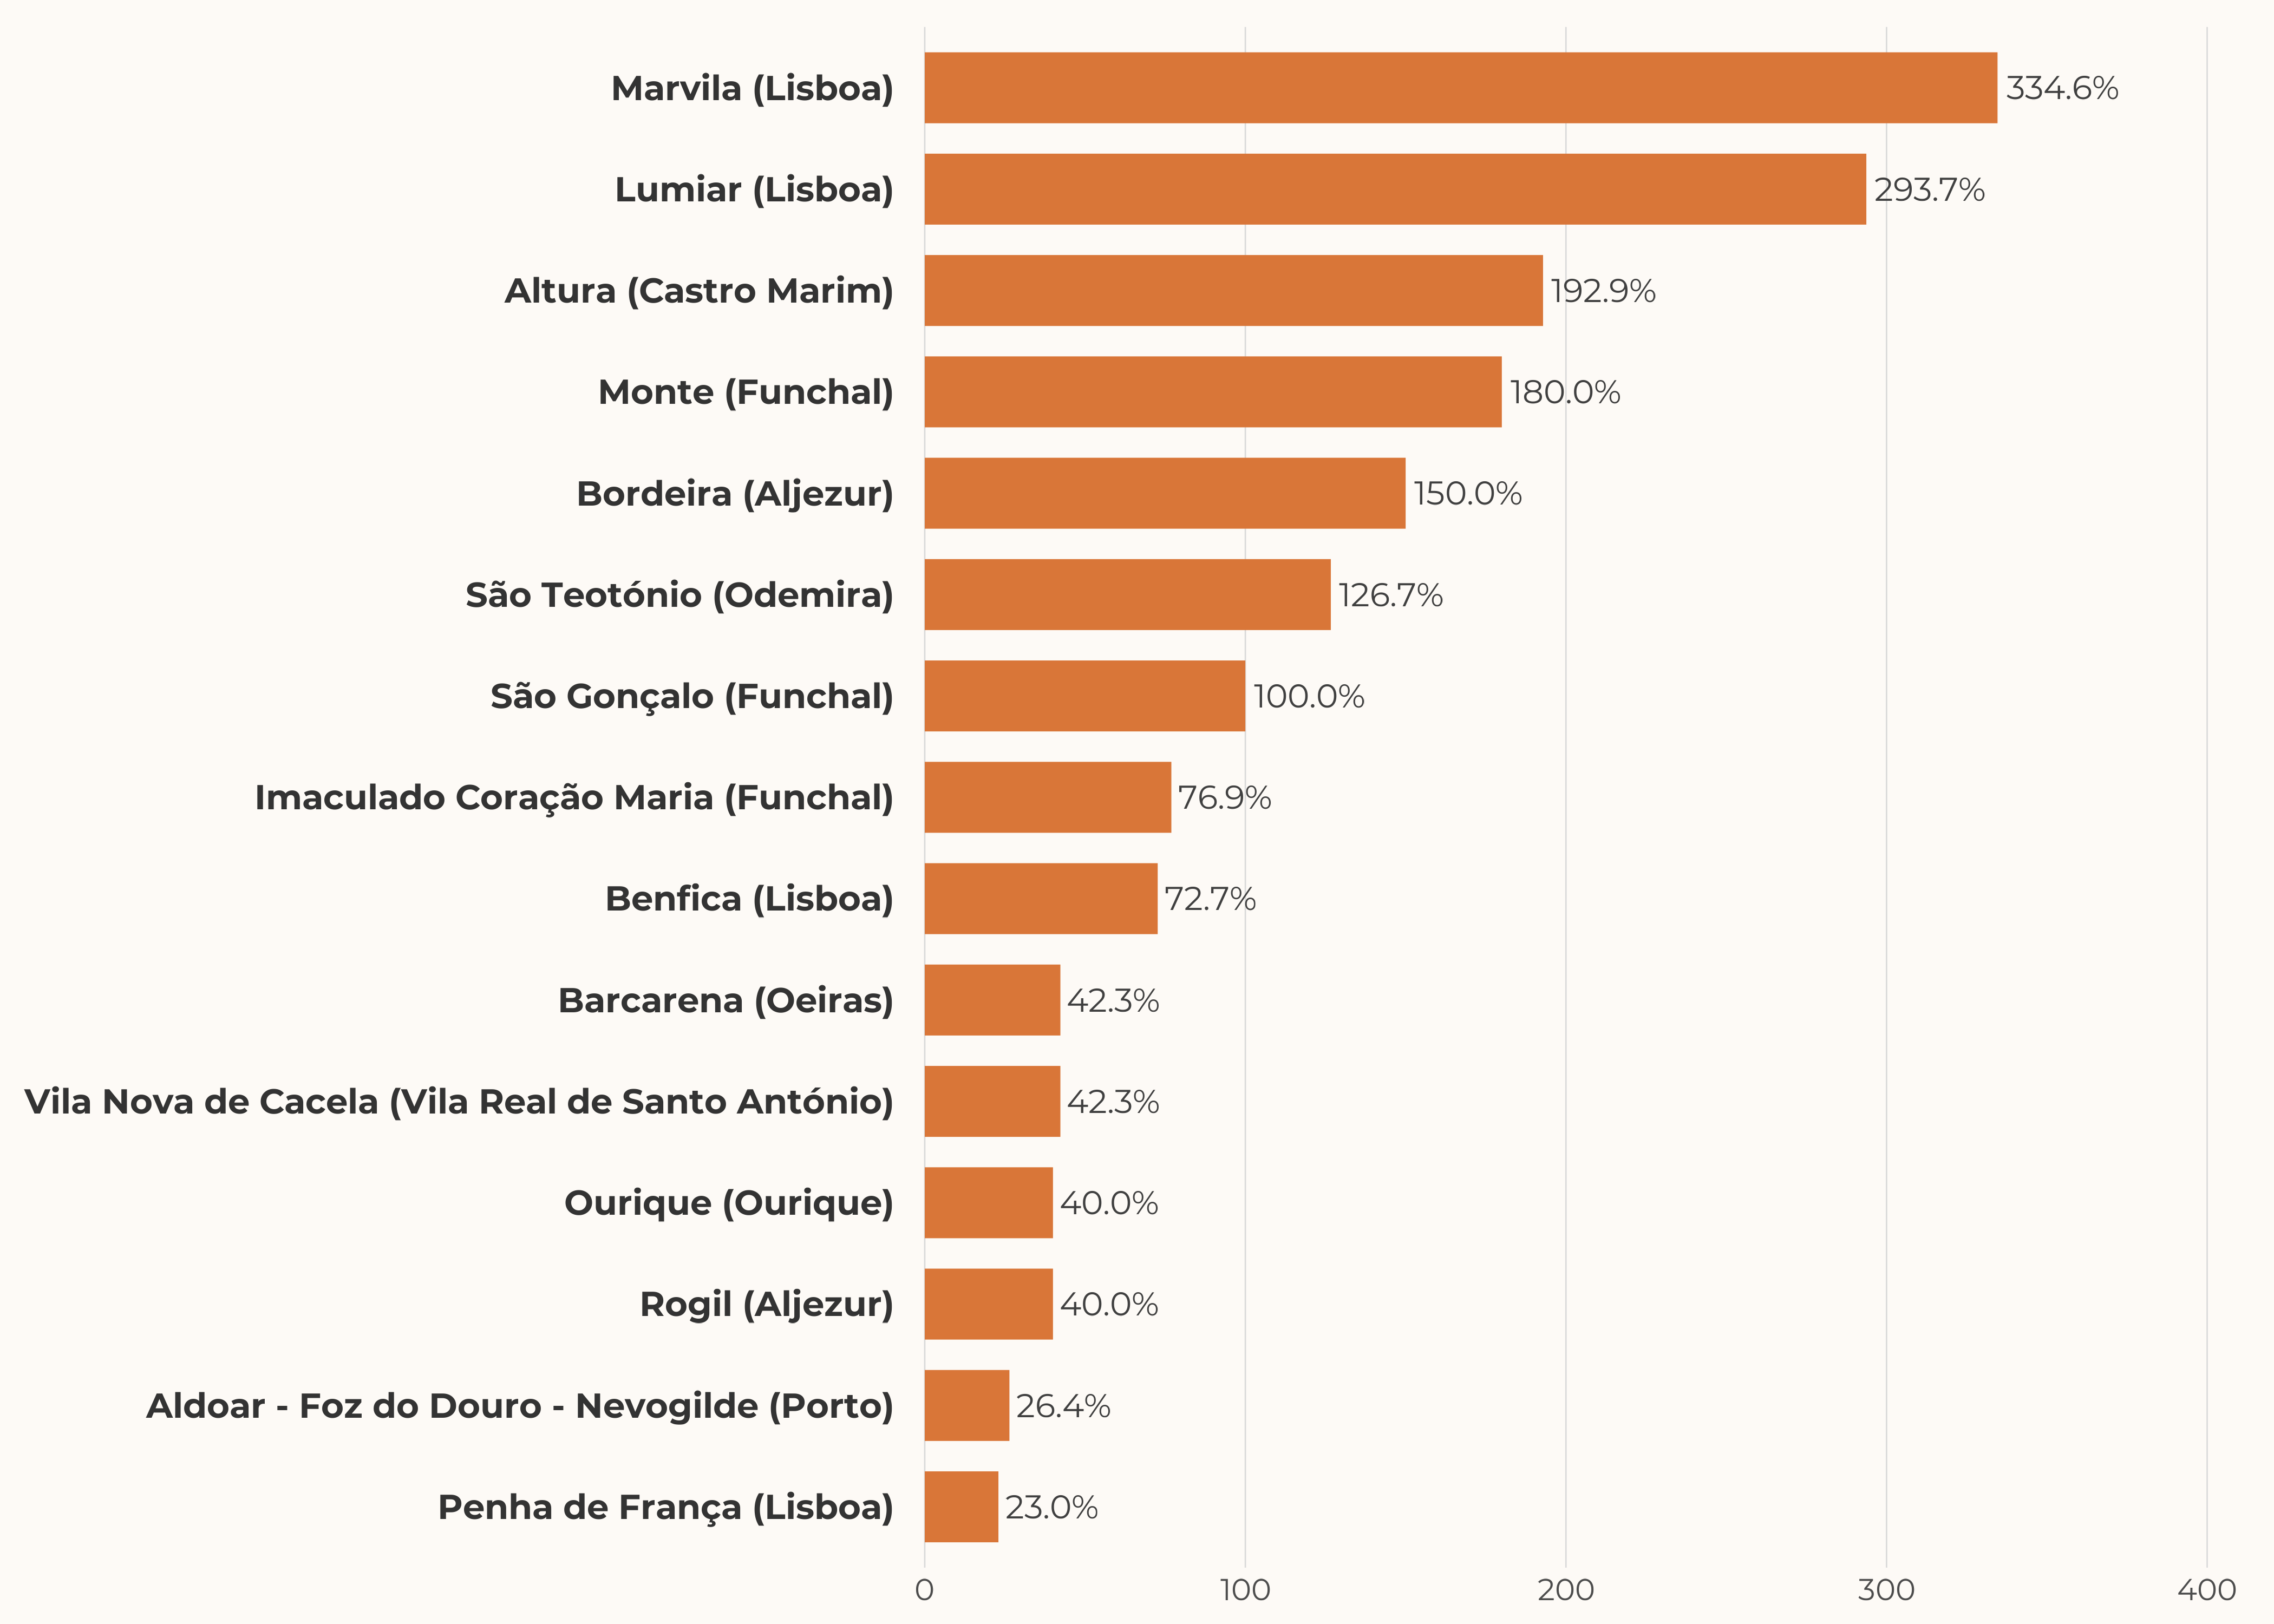
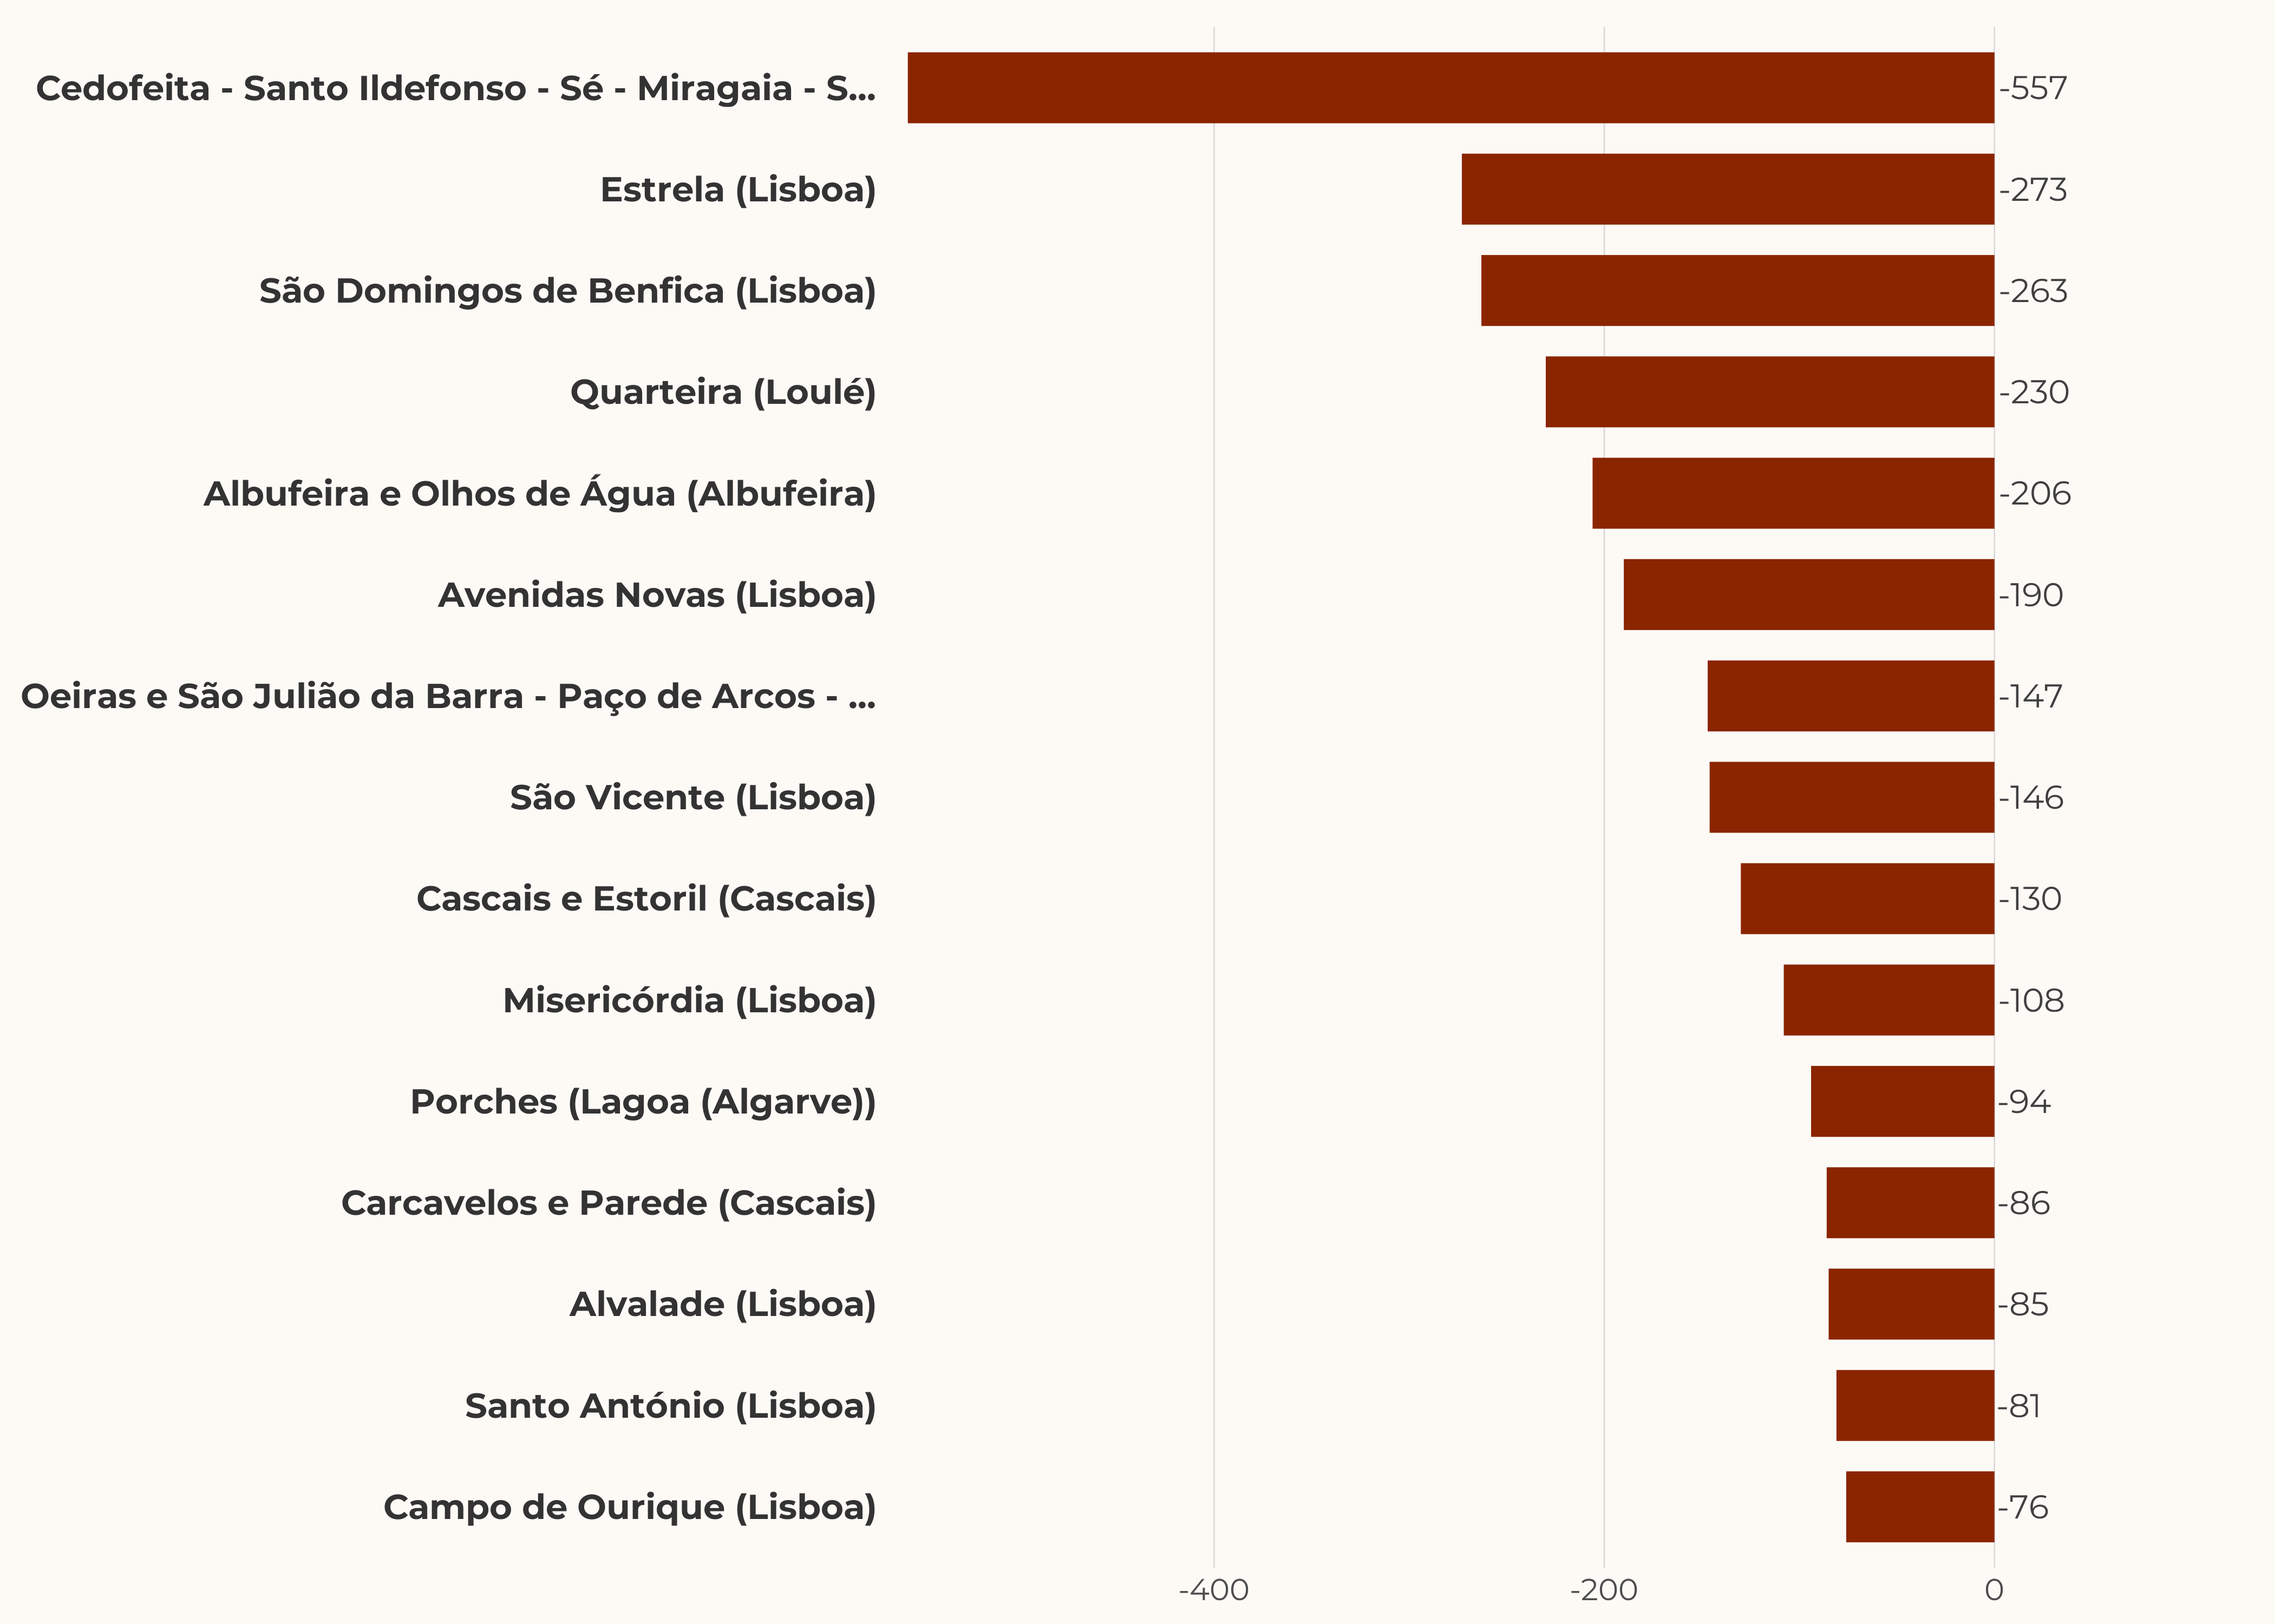
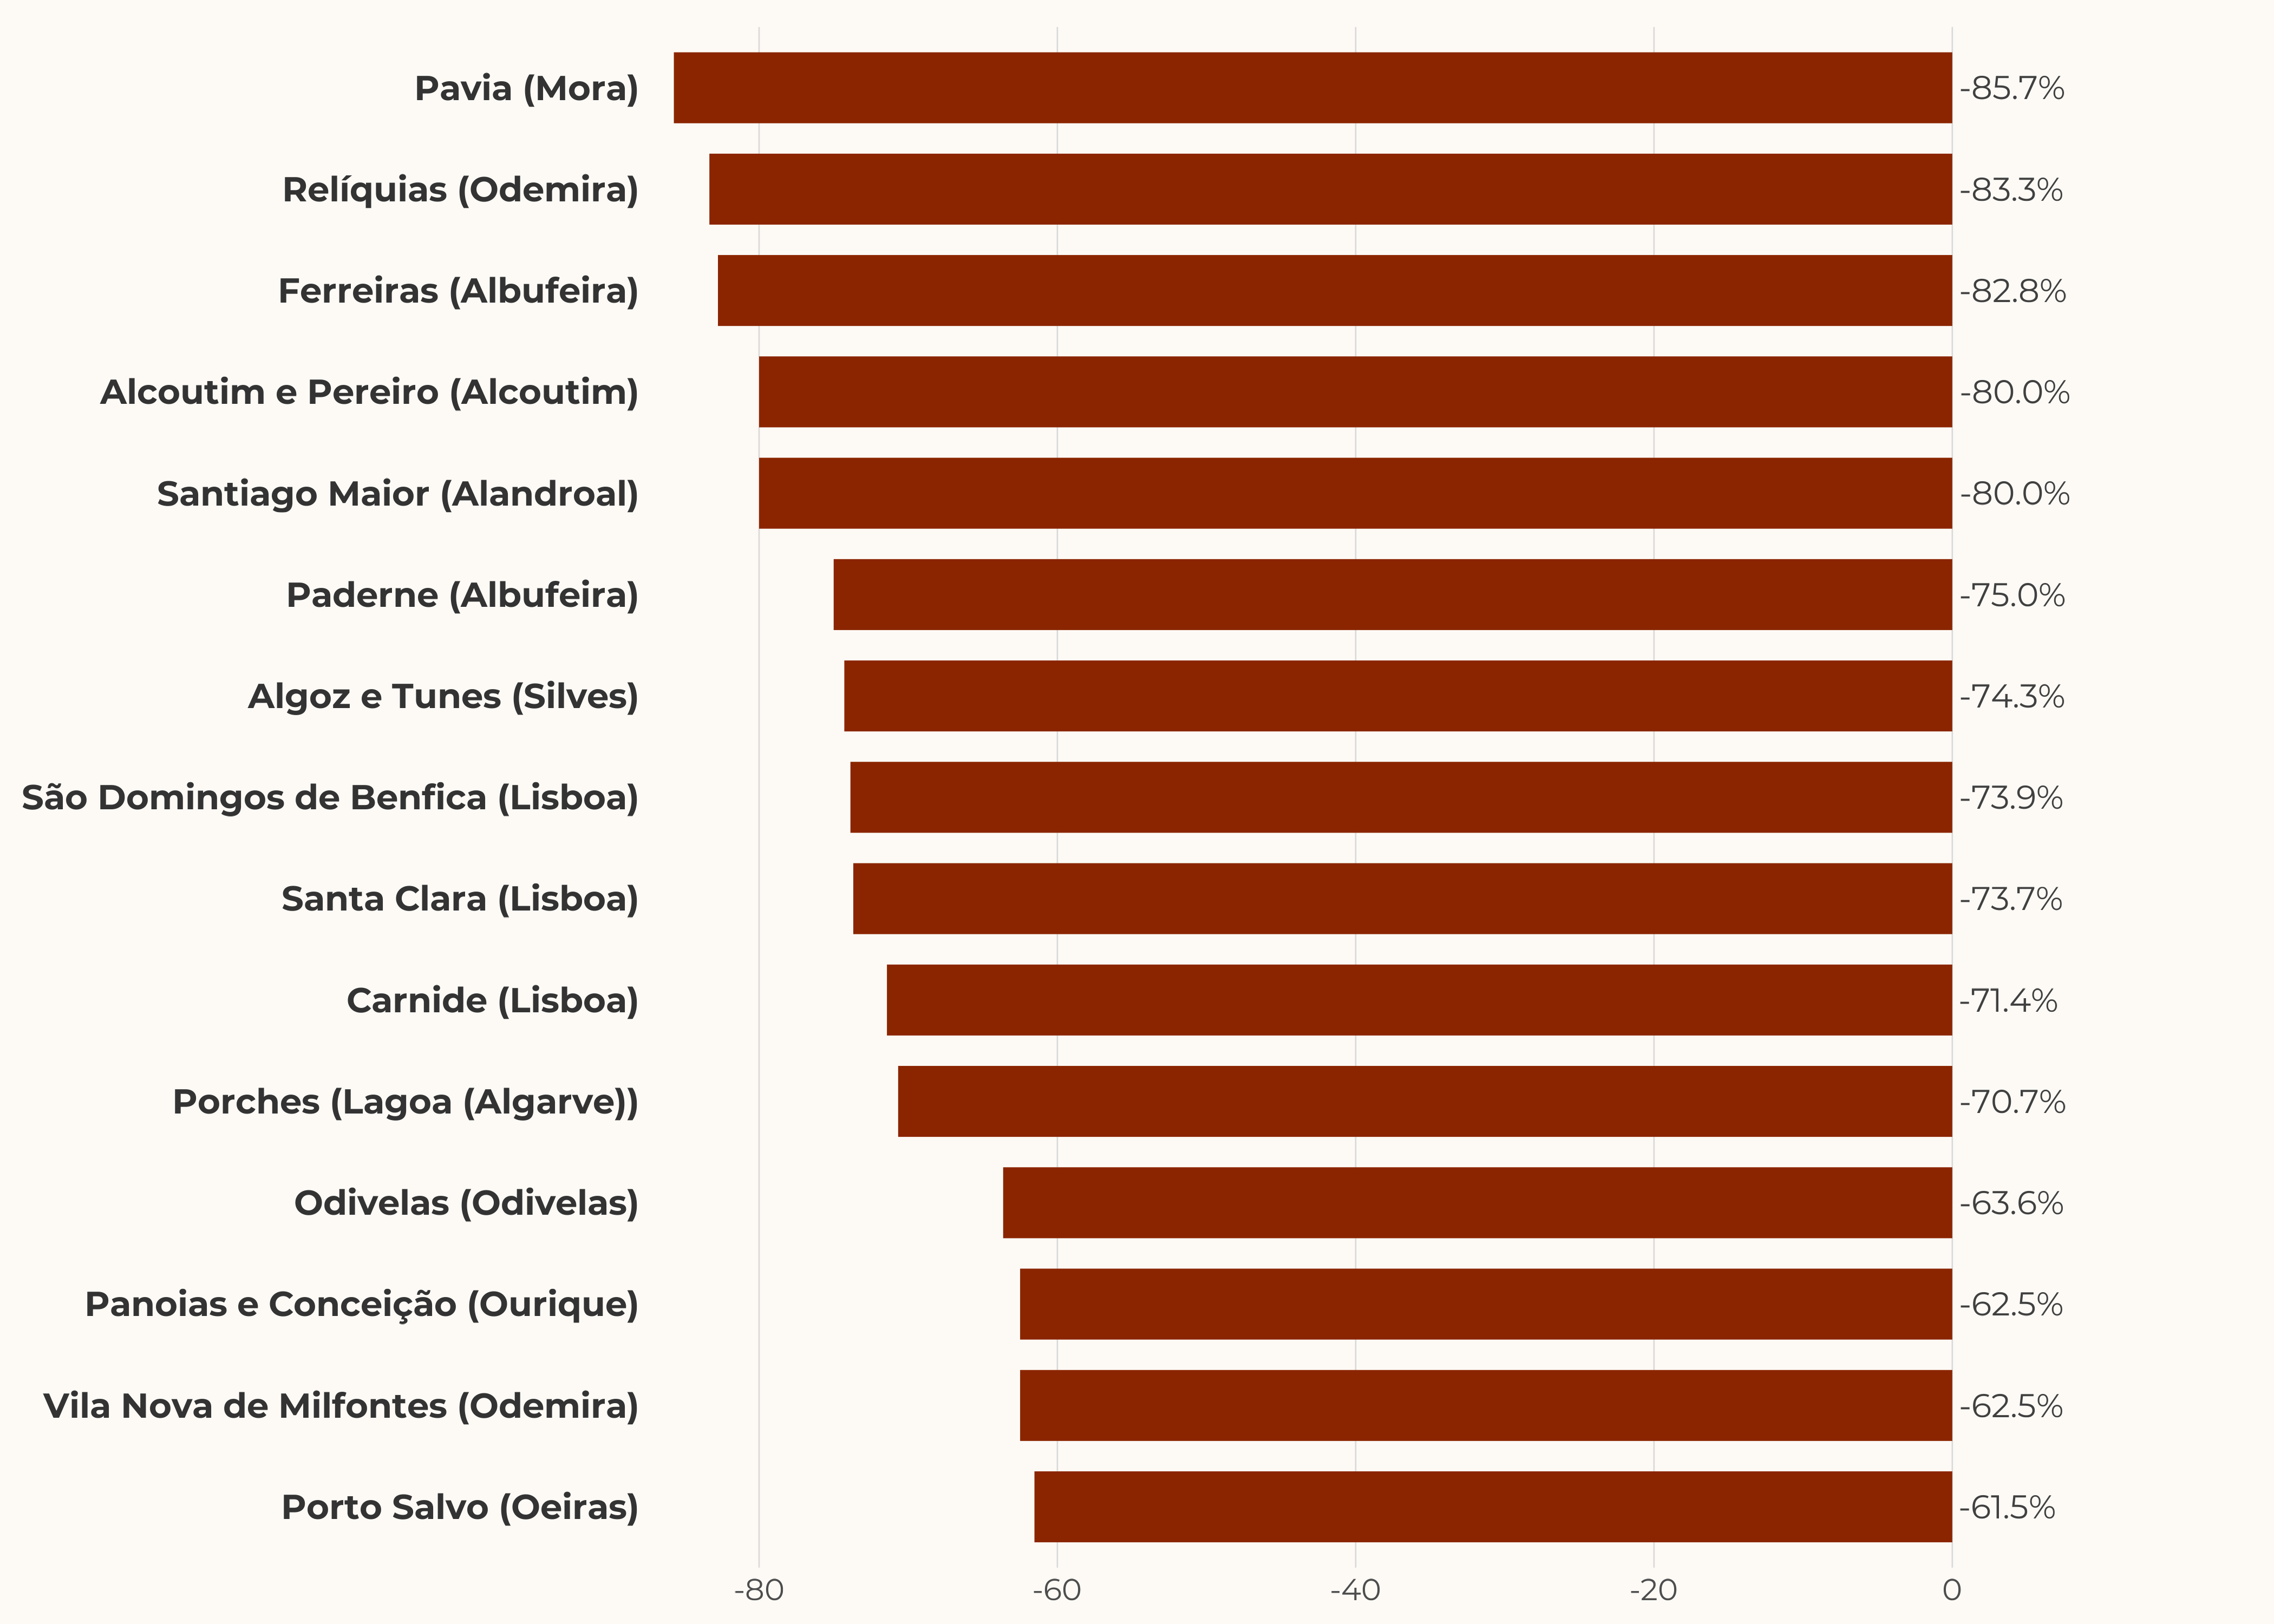
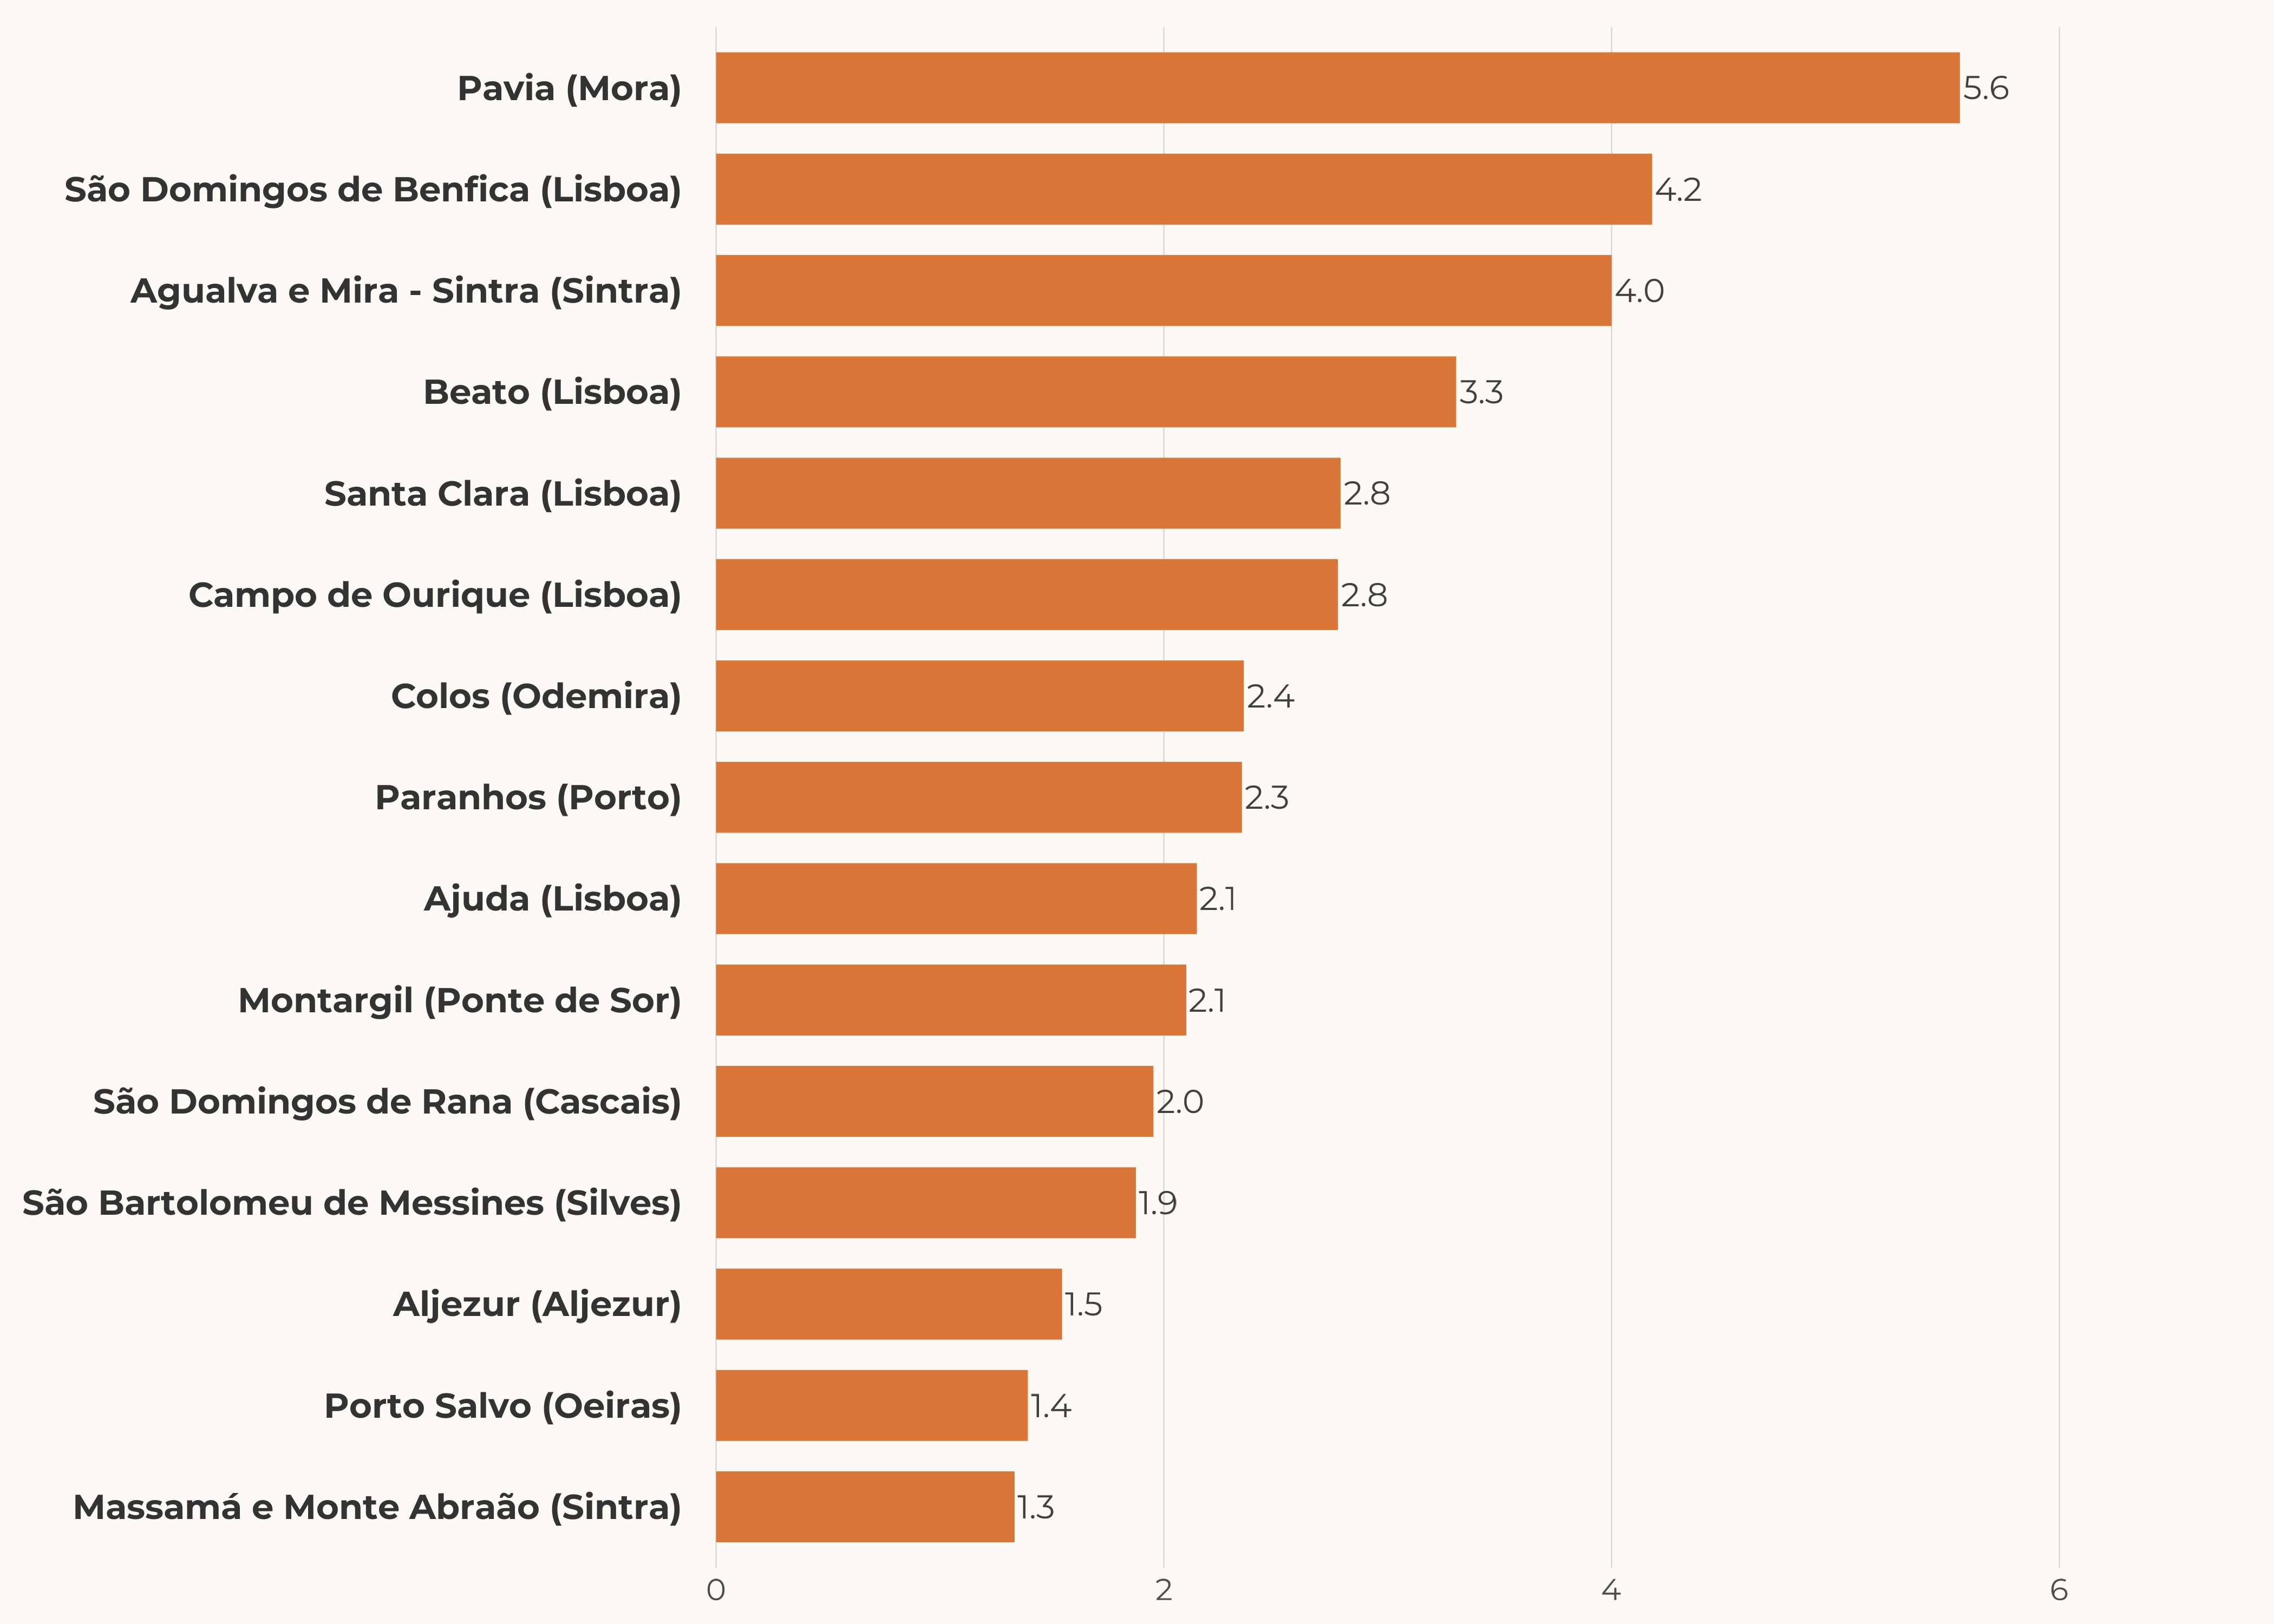
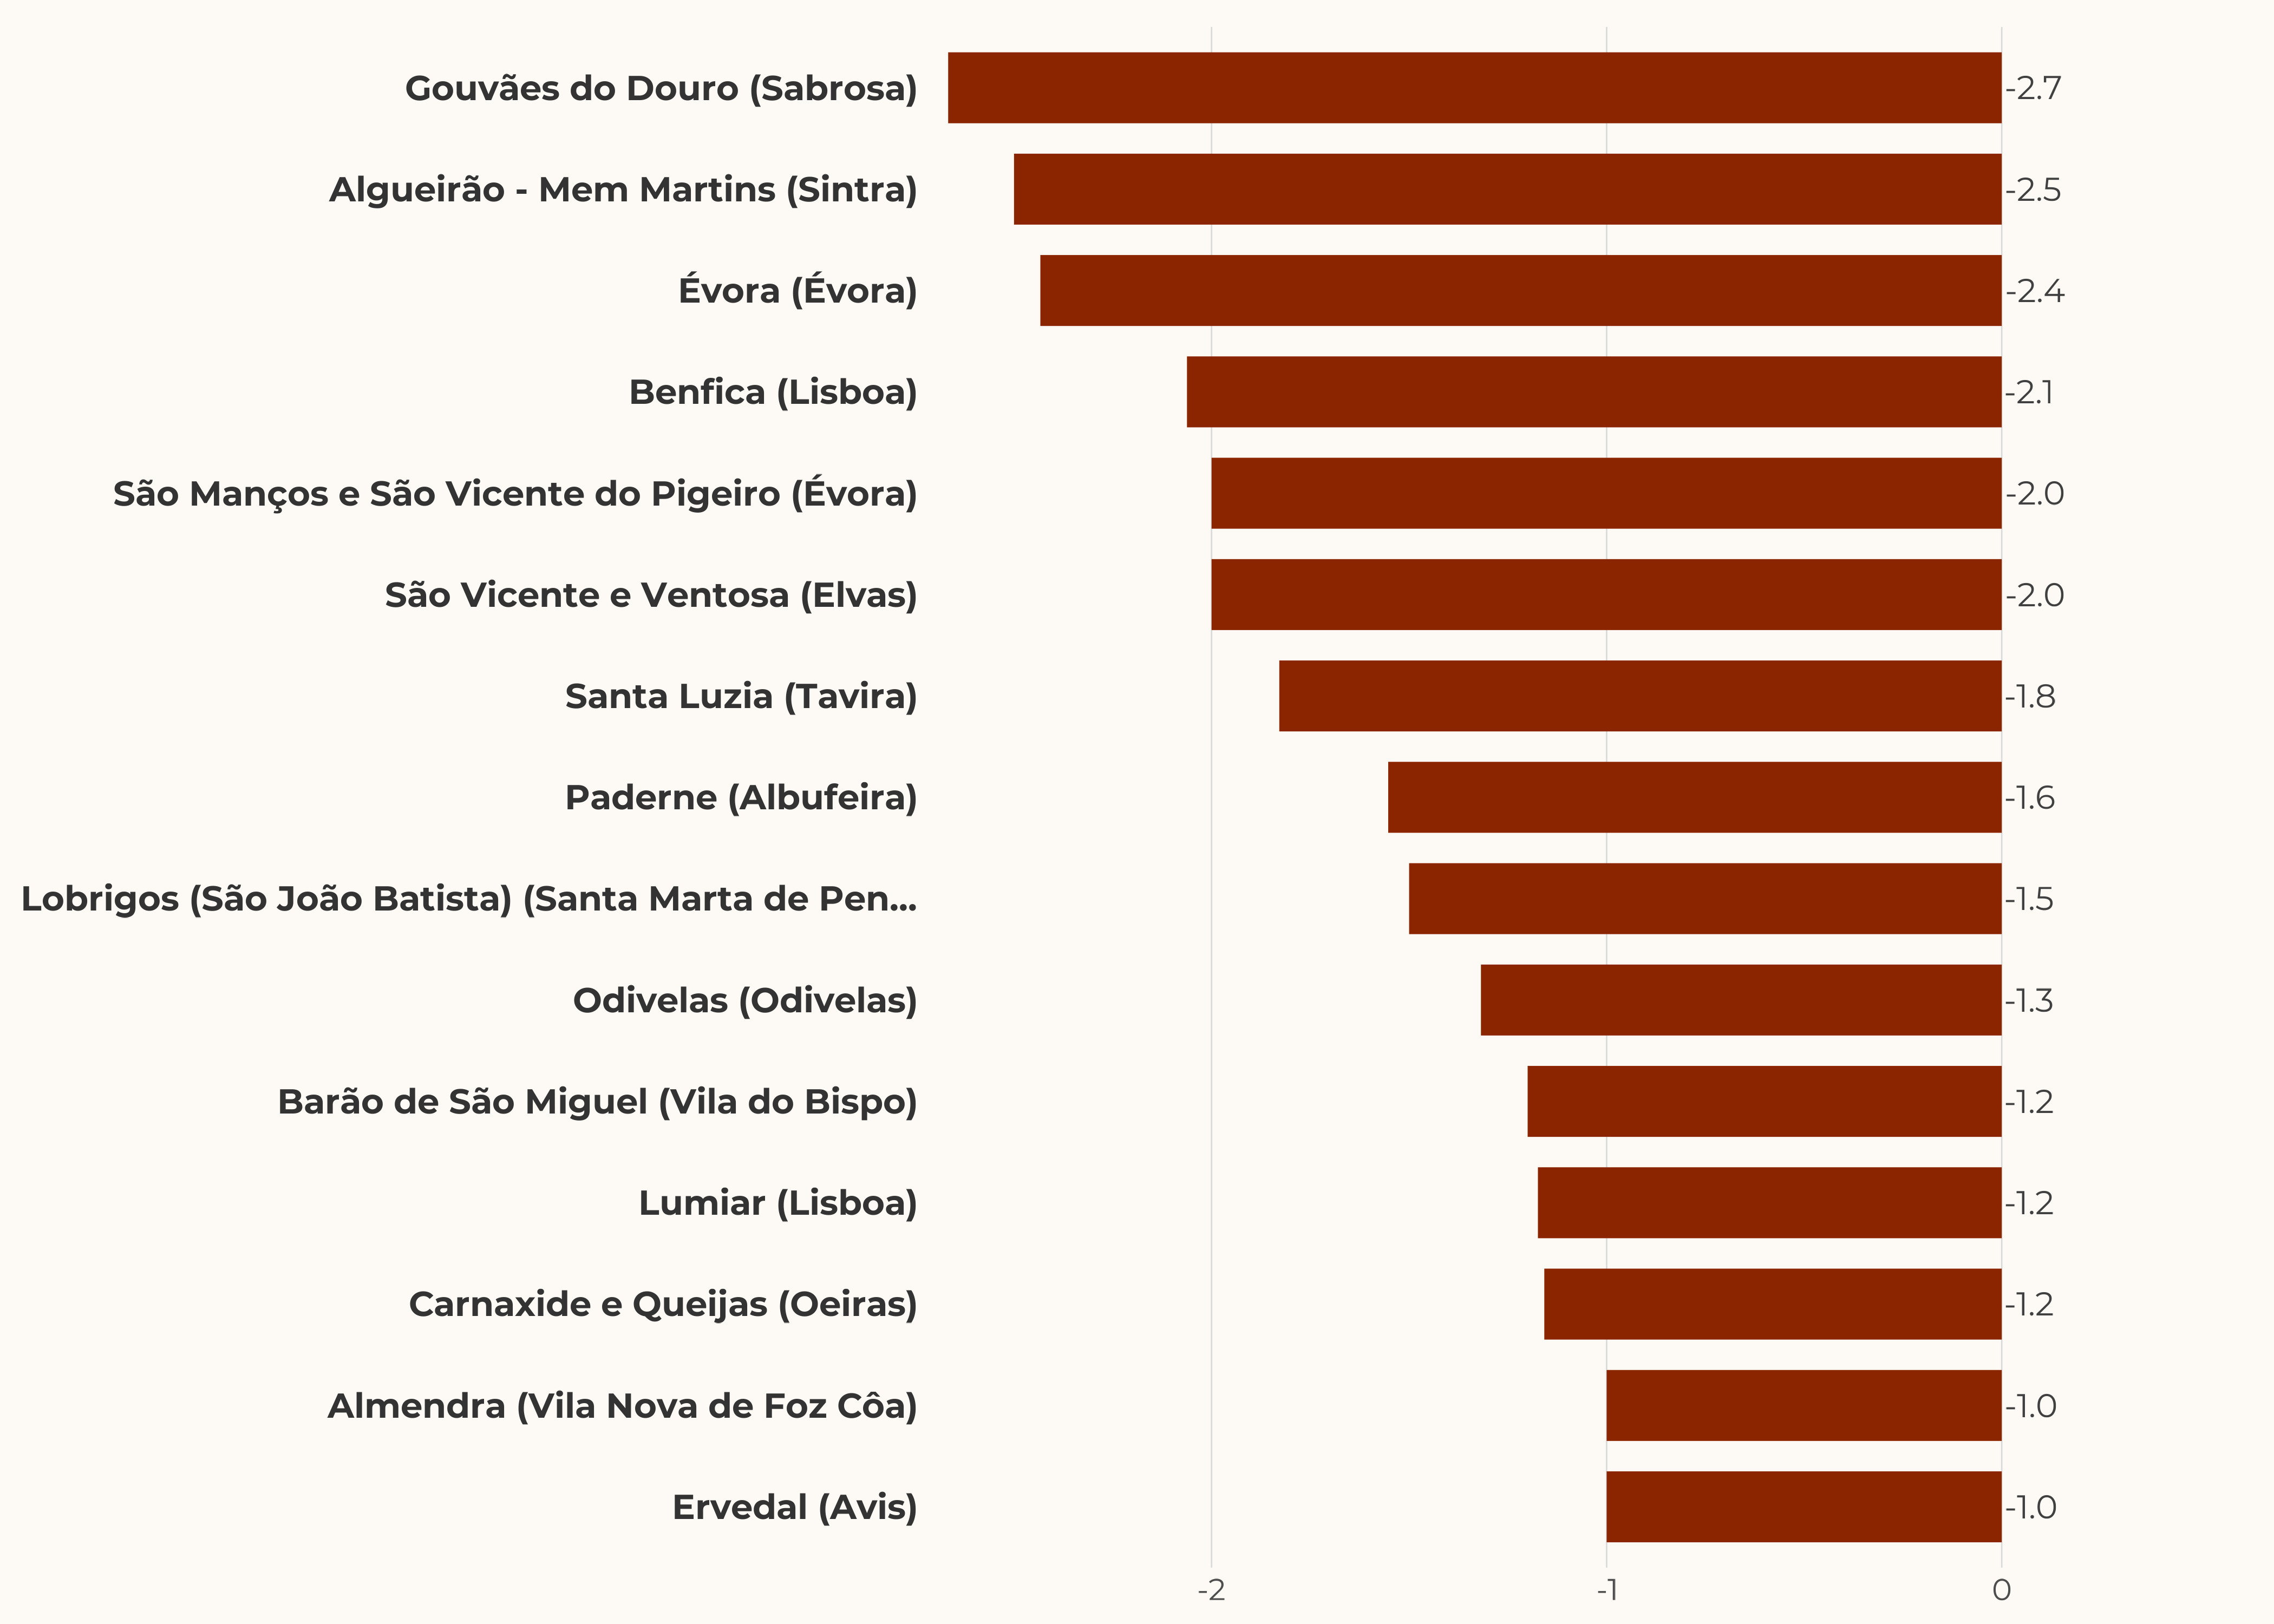
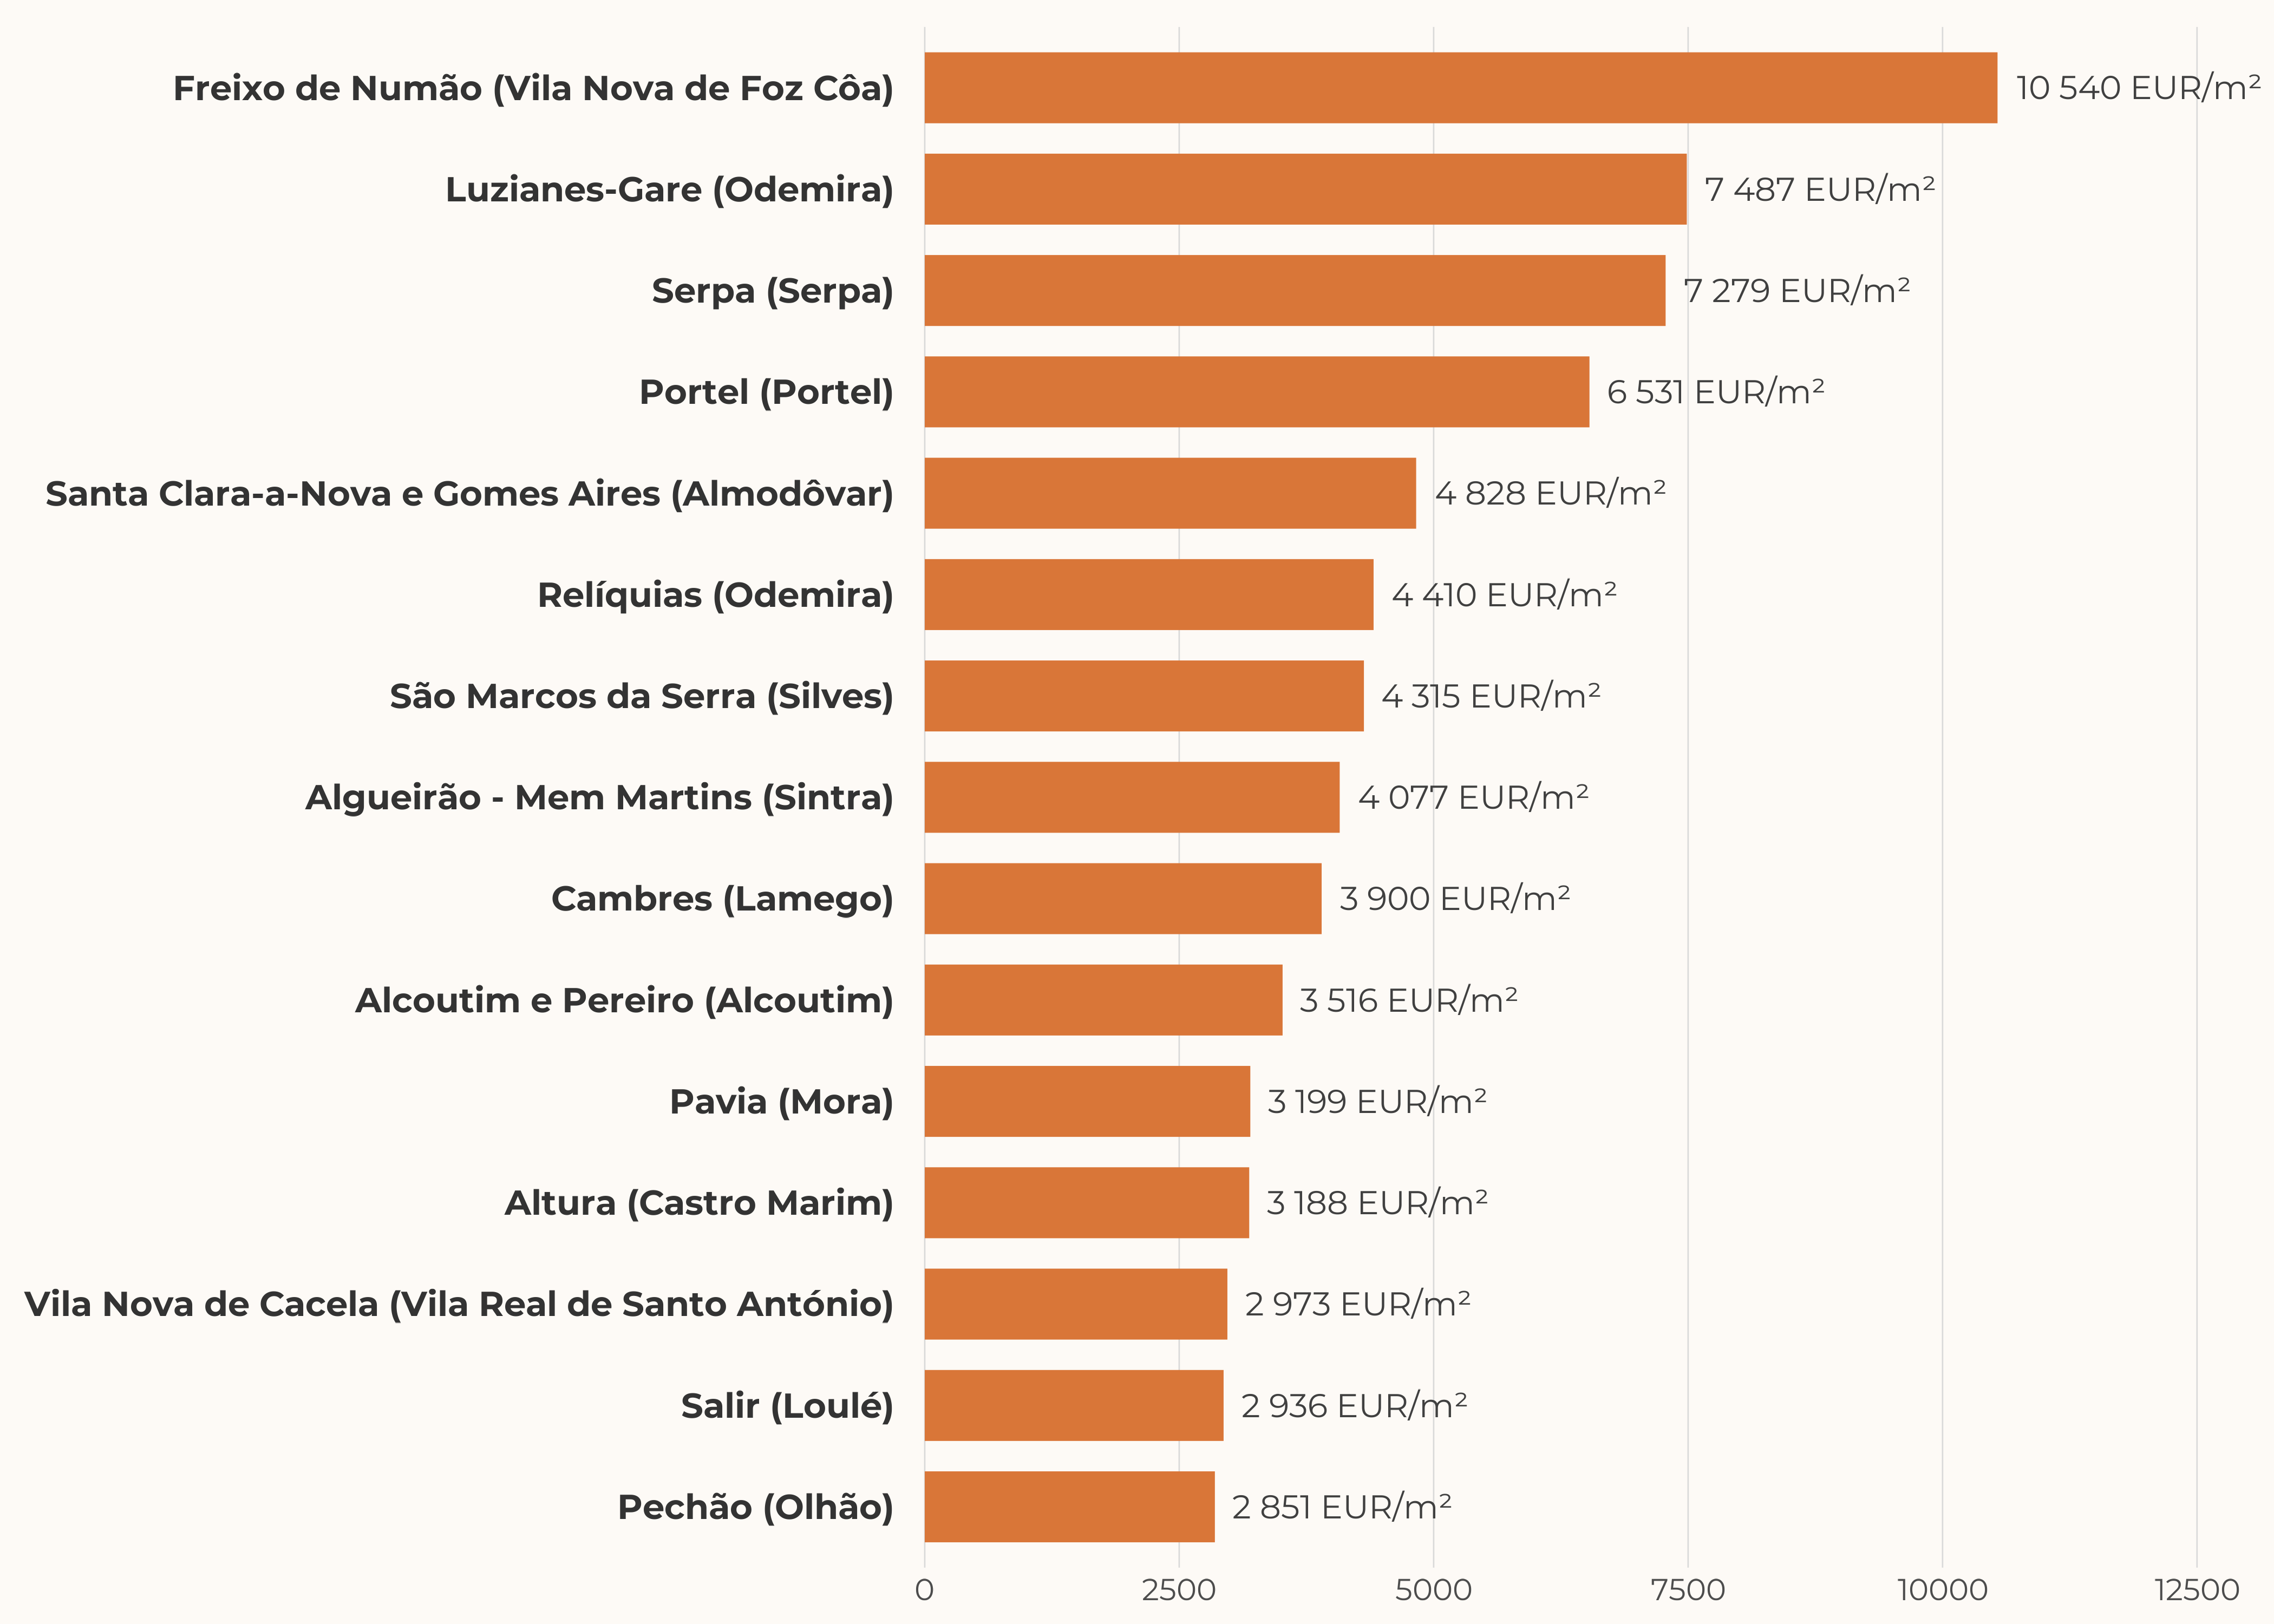
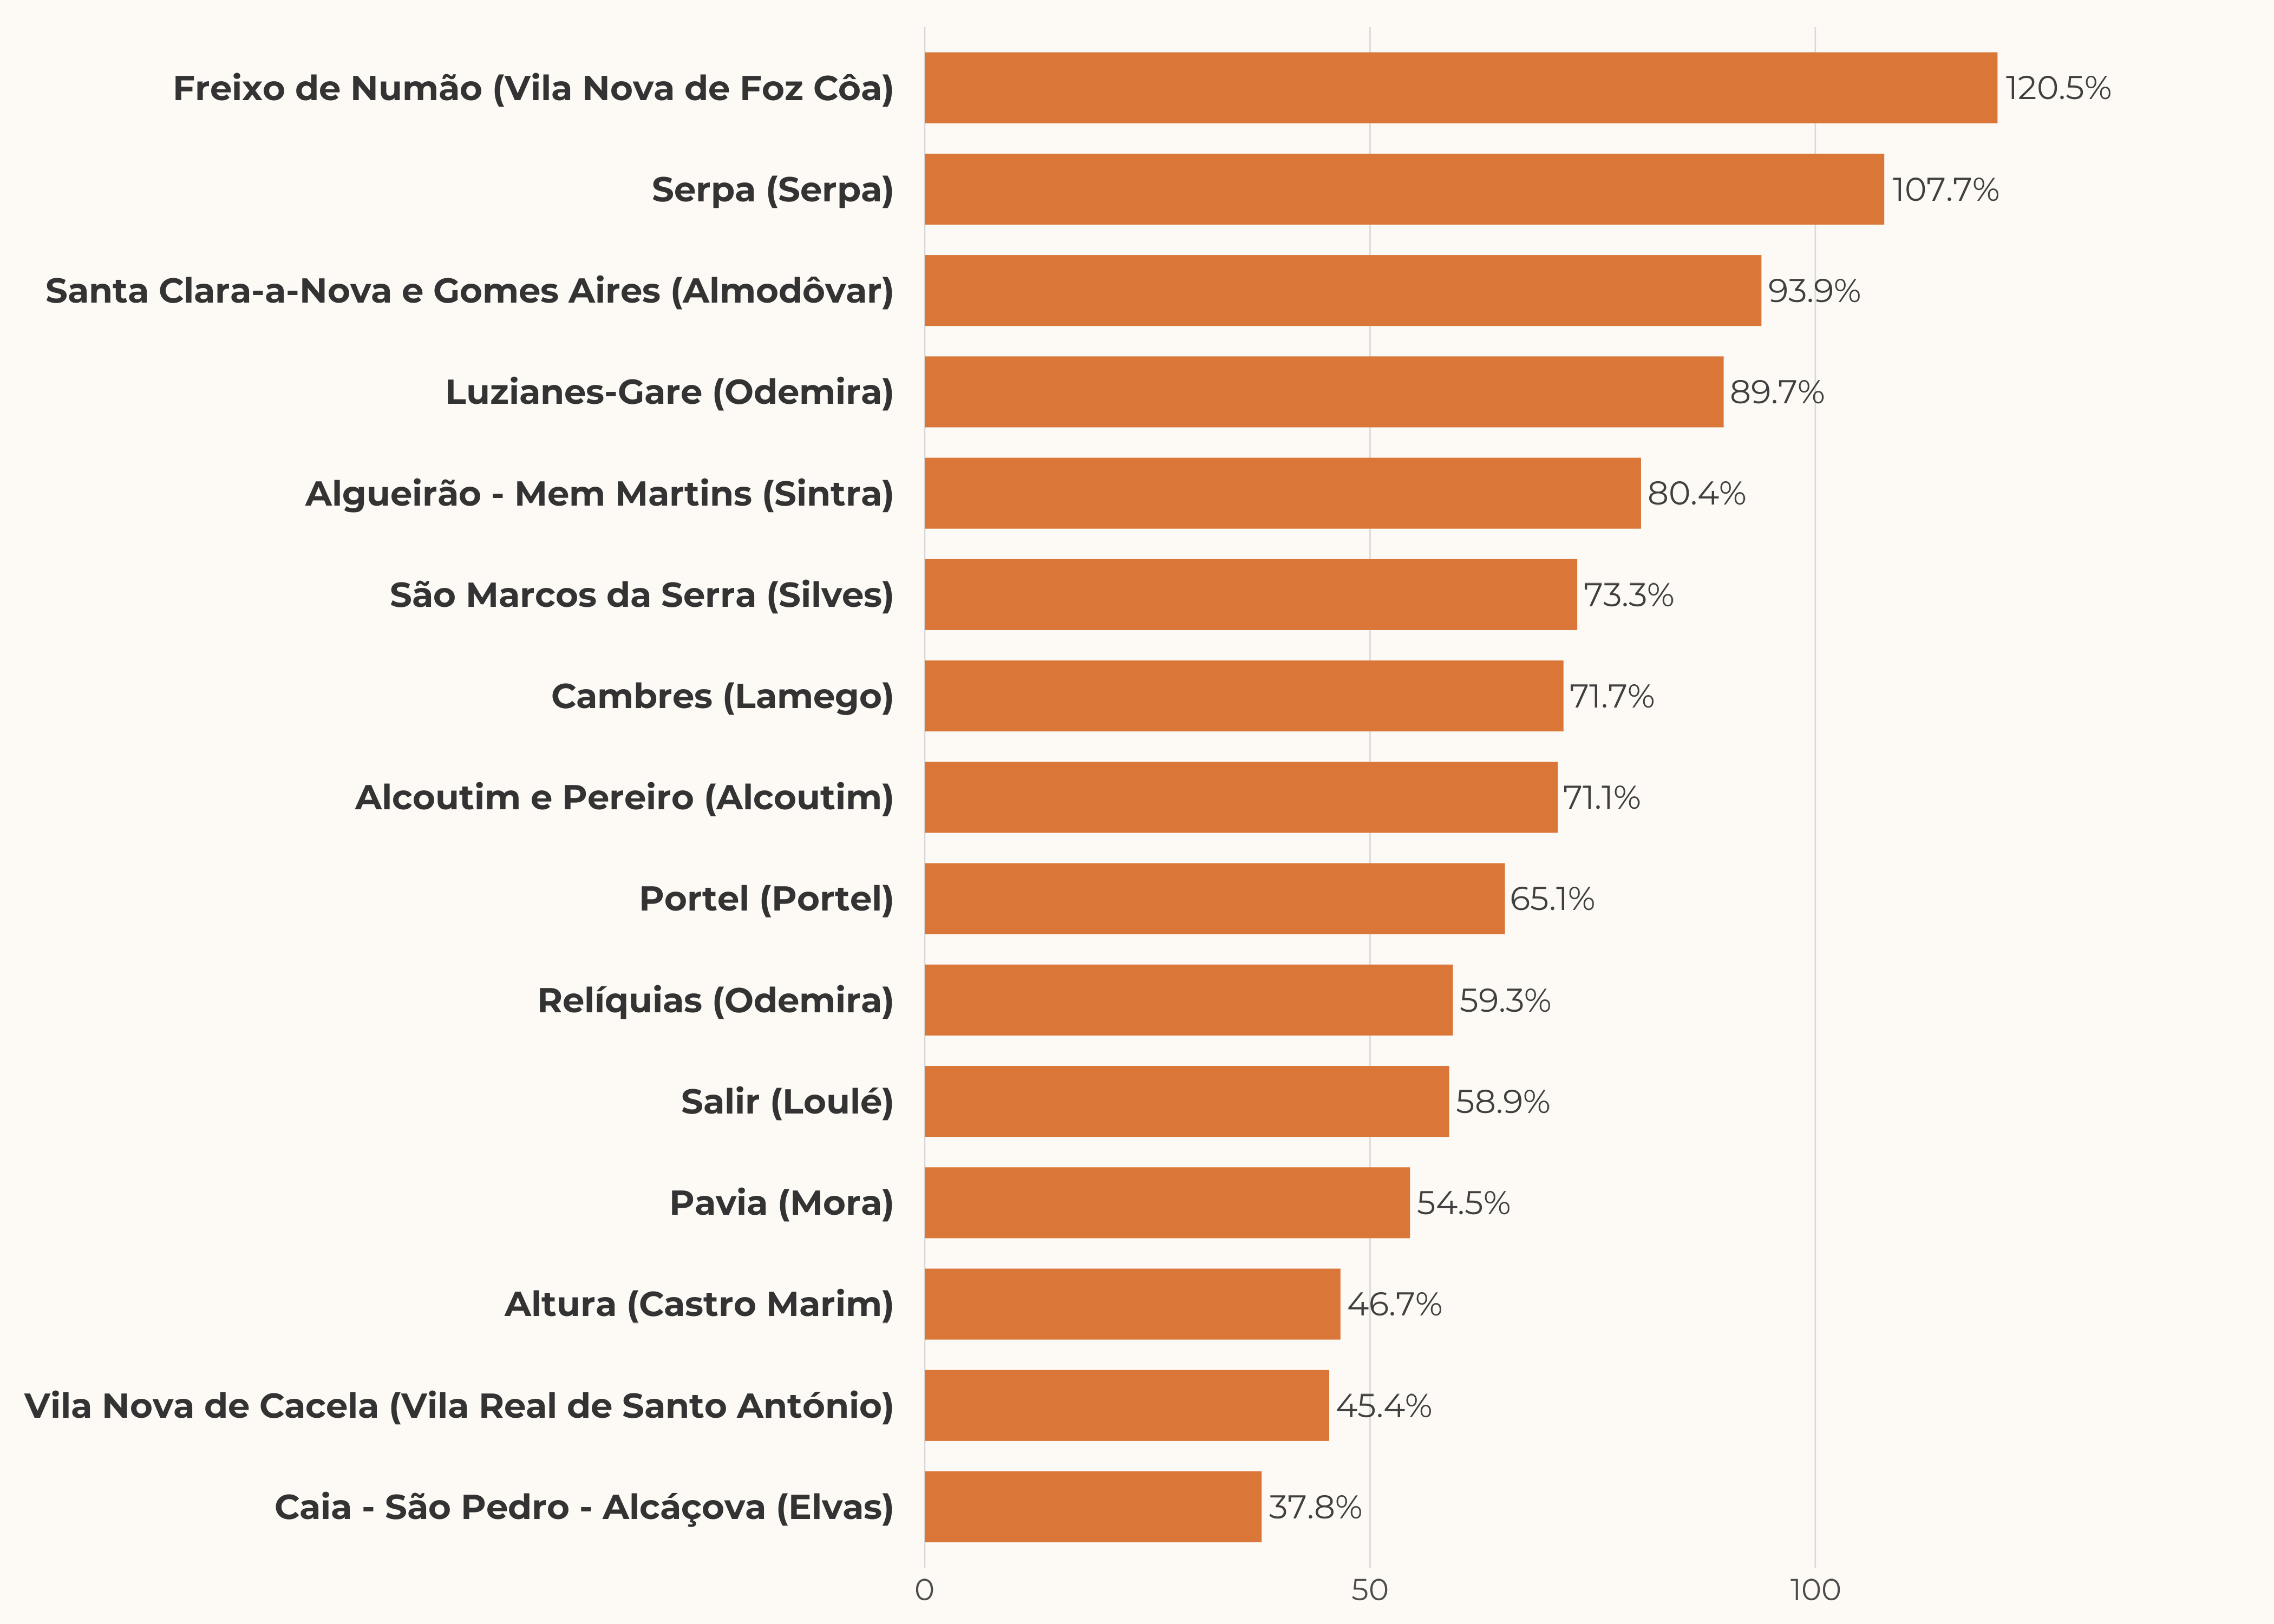
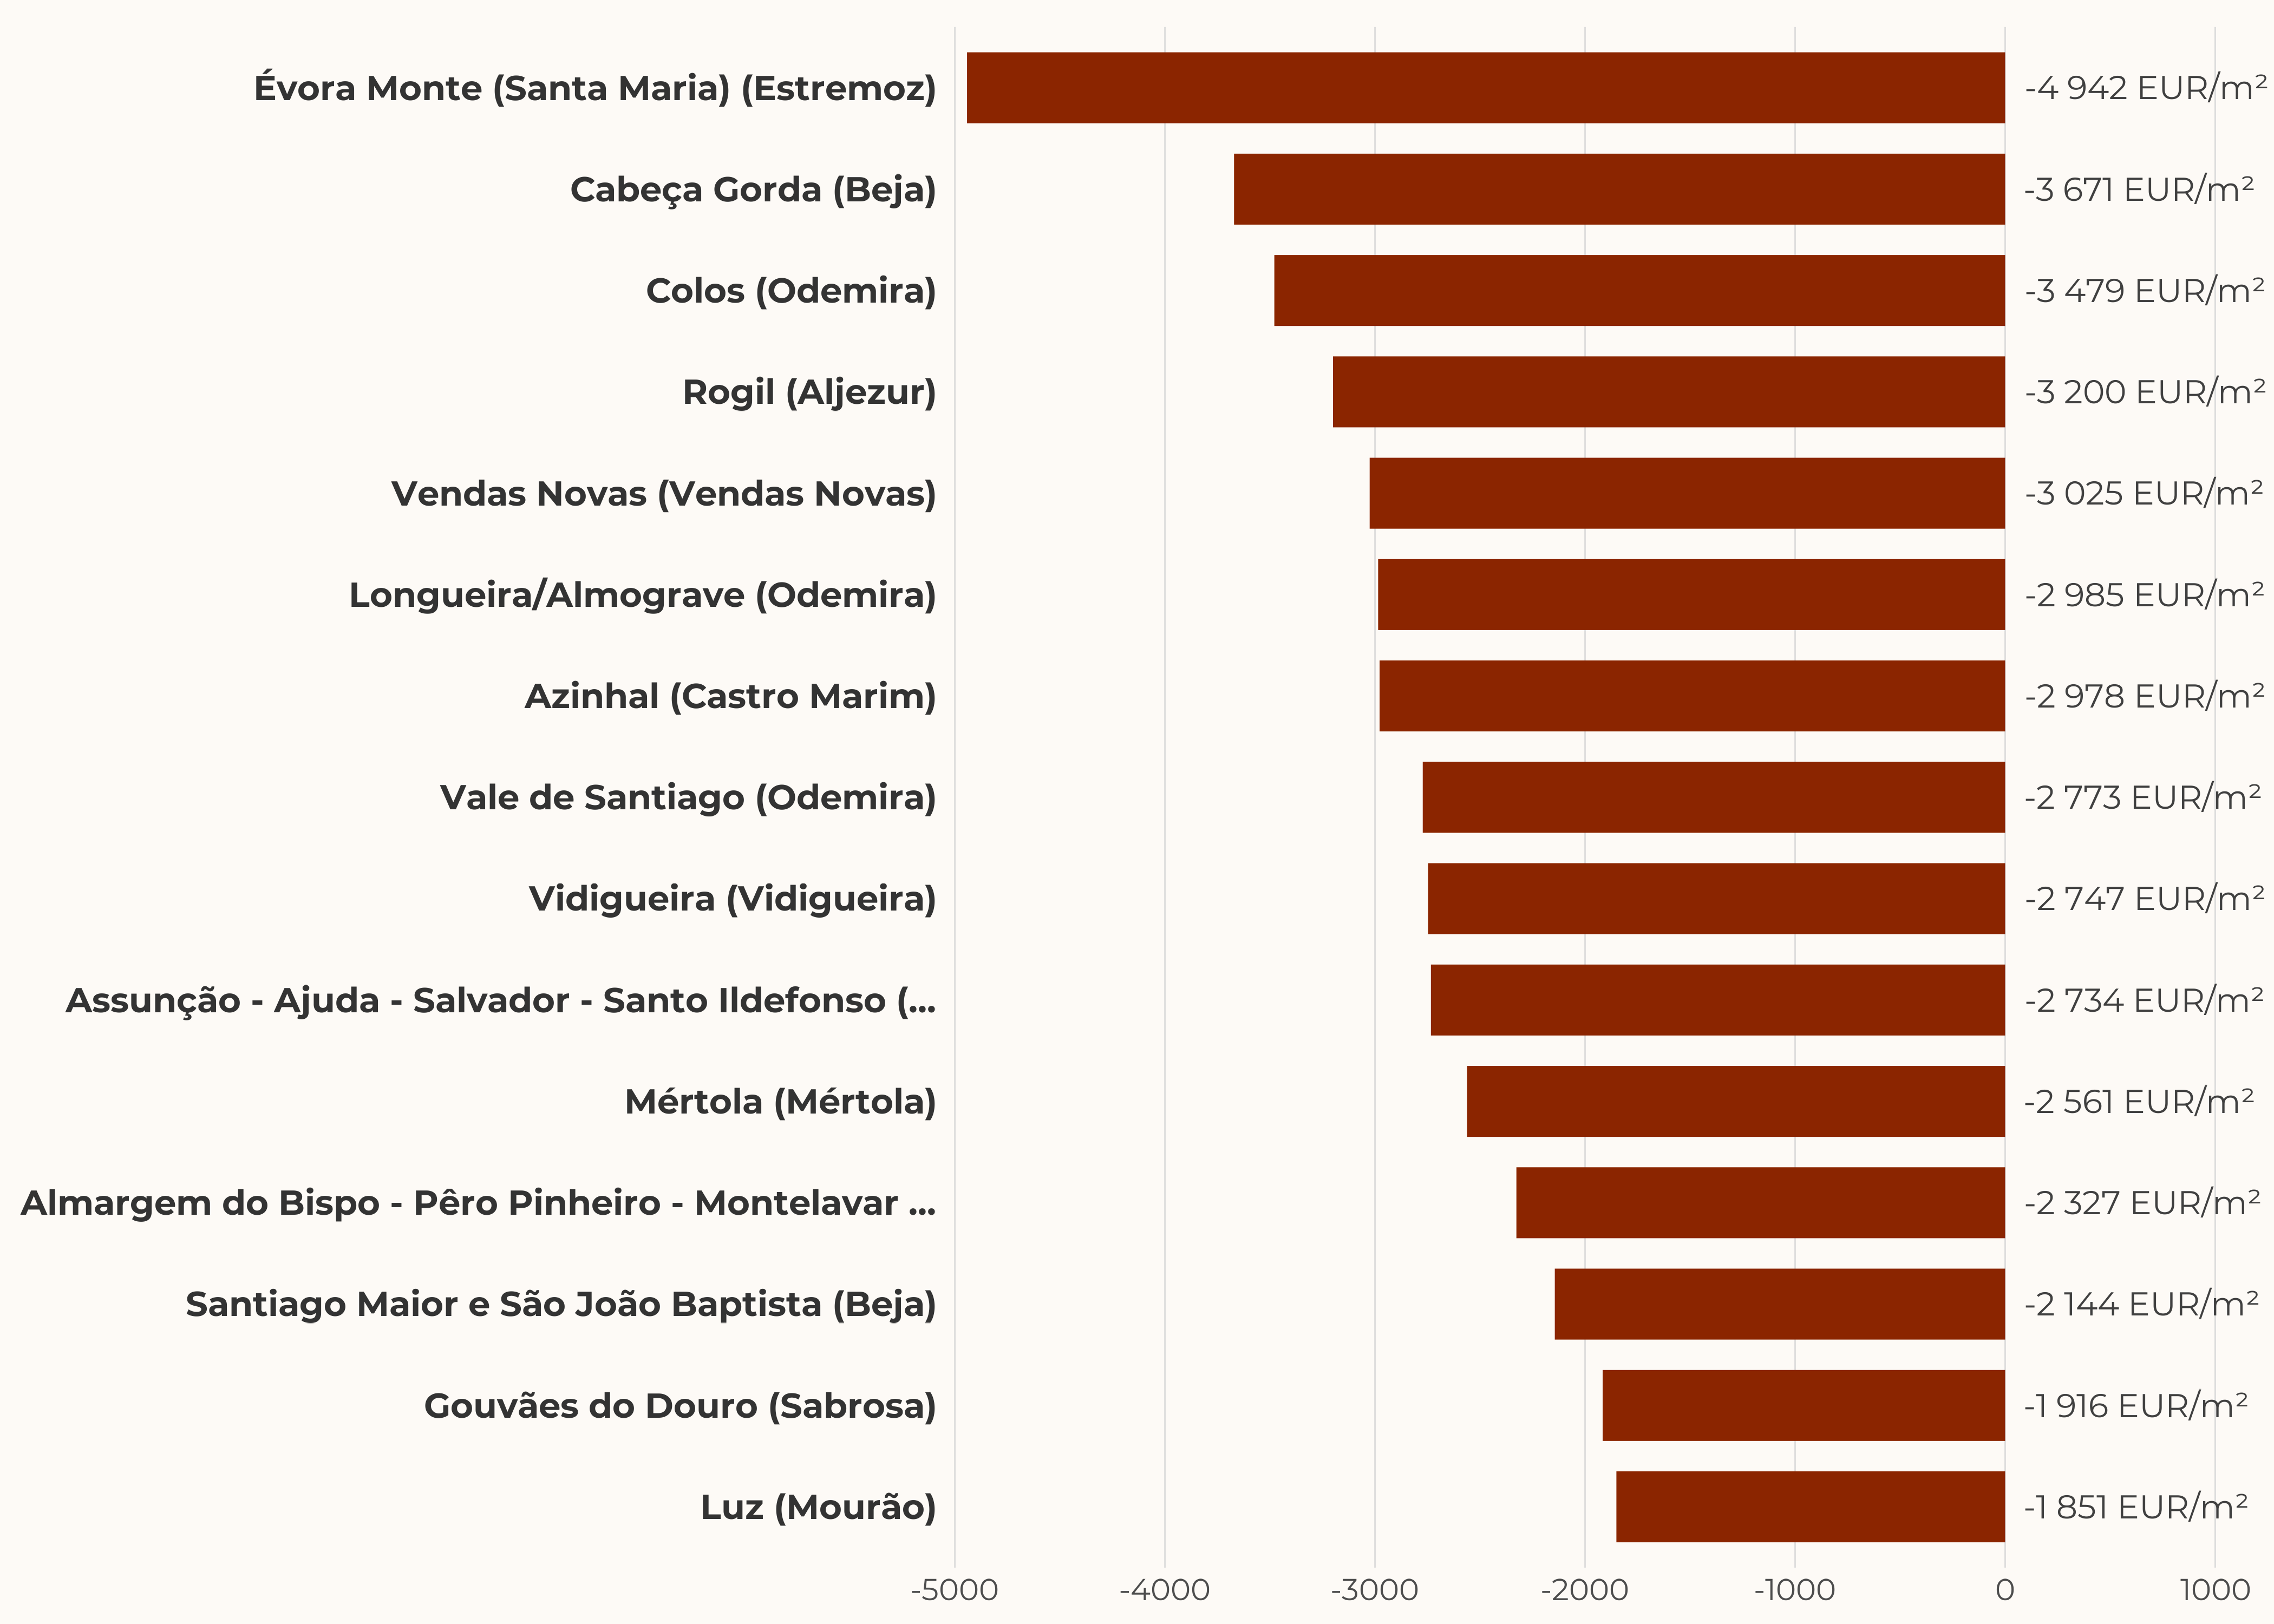
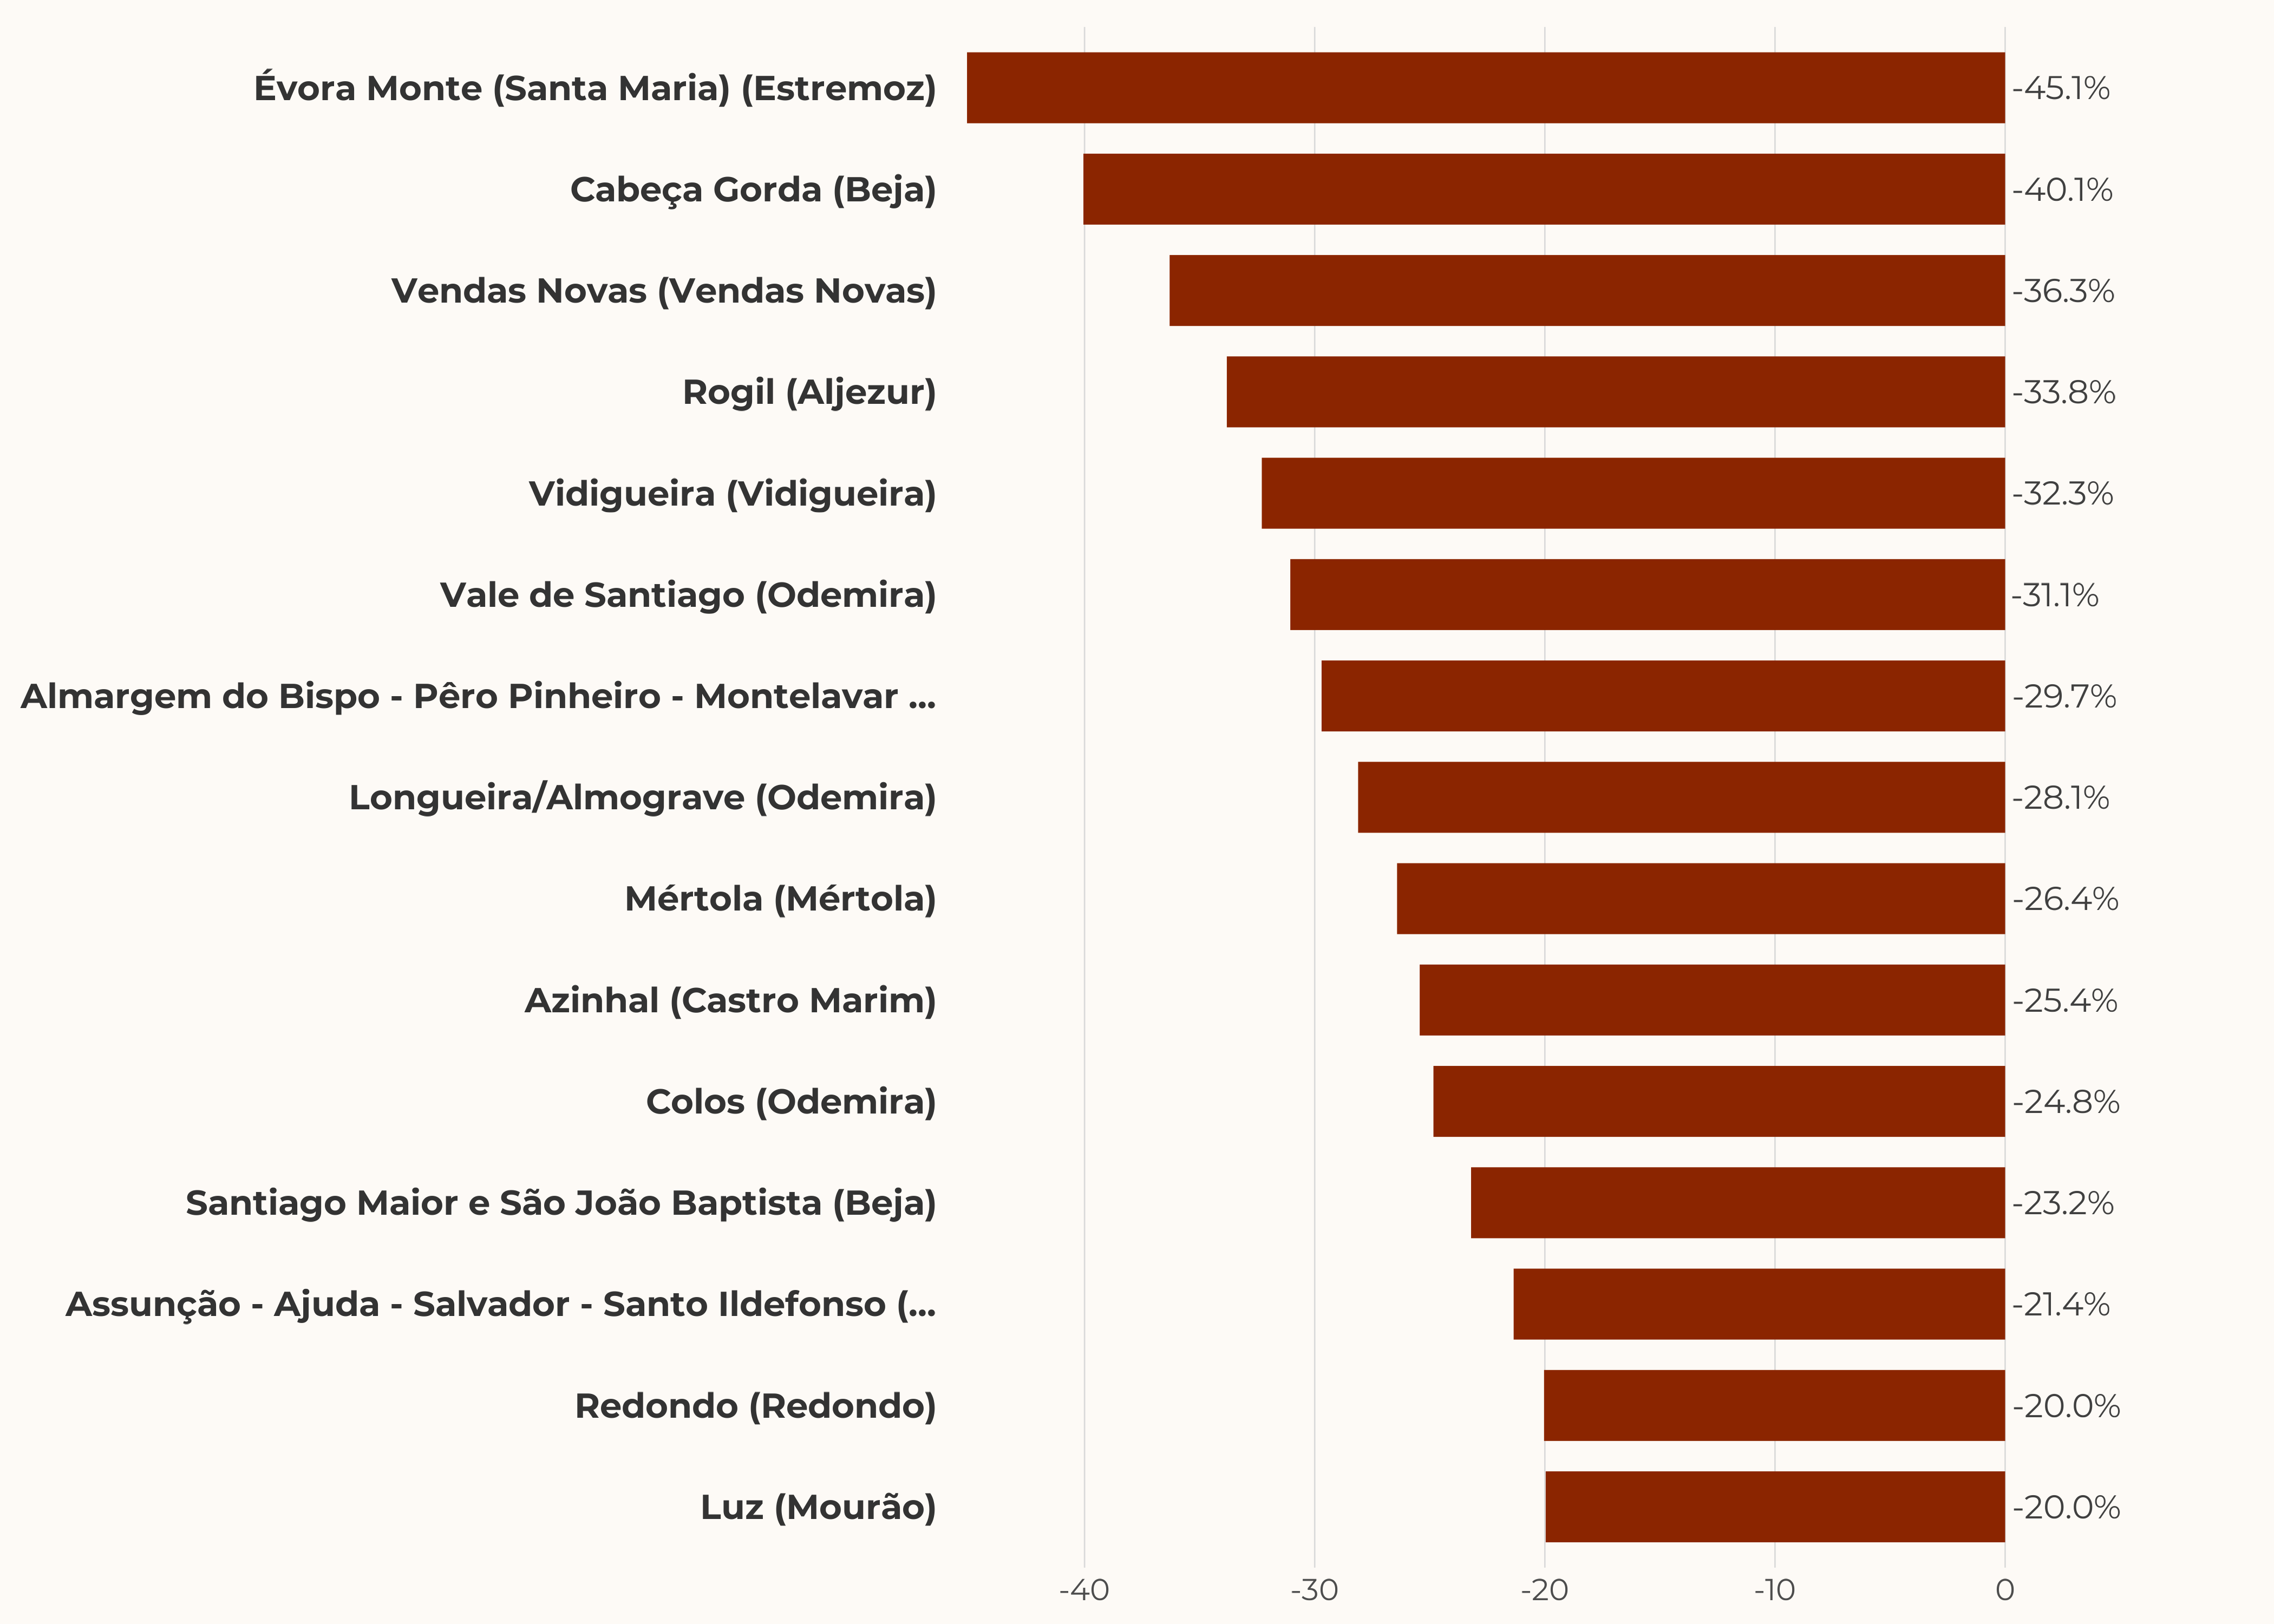
Supply variation at the parish level
Despite the national downward trend, some parishes recorded significant supply increases, while the steepest declines are concentrated in high-demand areas.
The market reached 169,812 transactions and EUR 41.2 bn in 2025 — both all-time highs
+8.6% vs 2024
+21.7% (record)
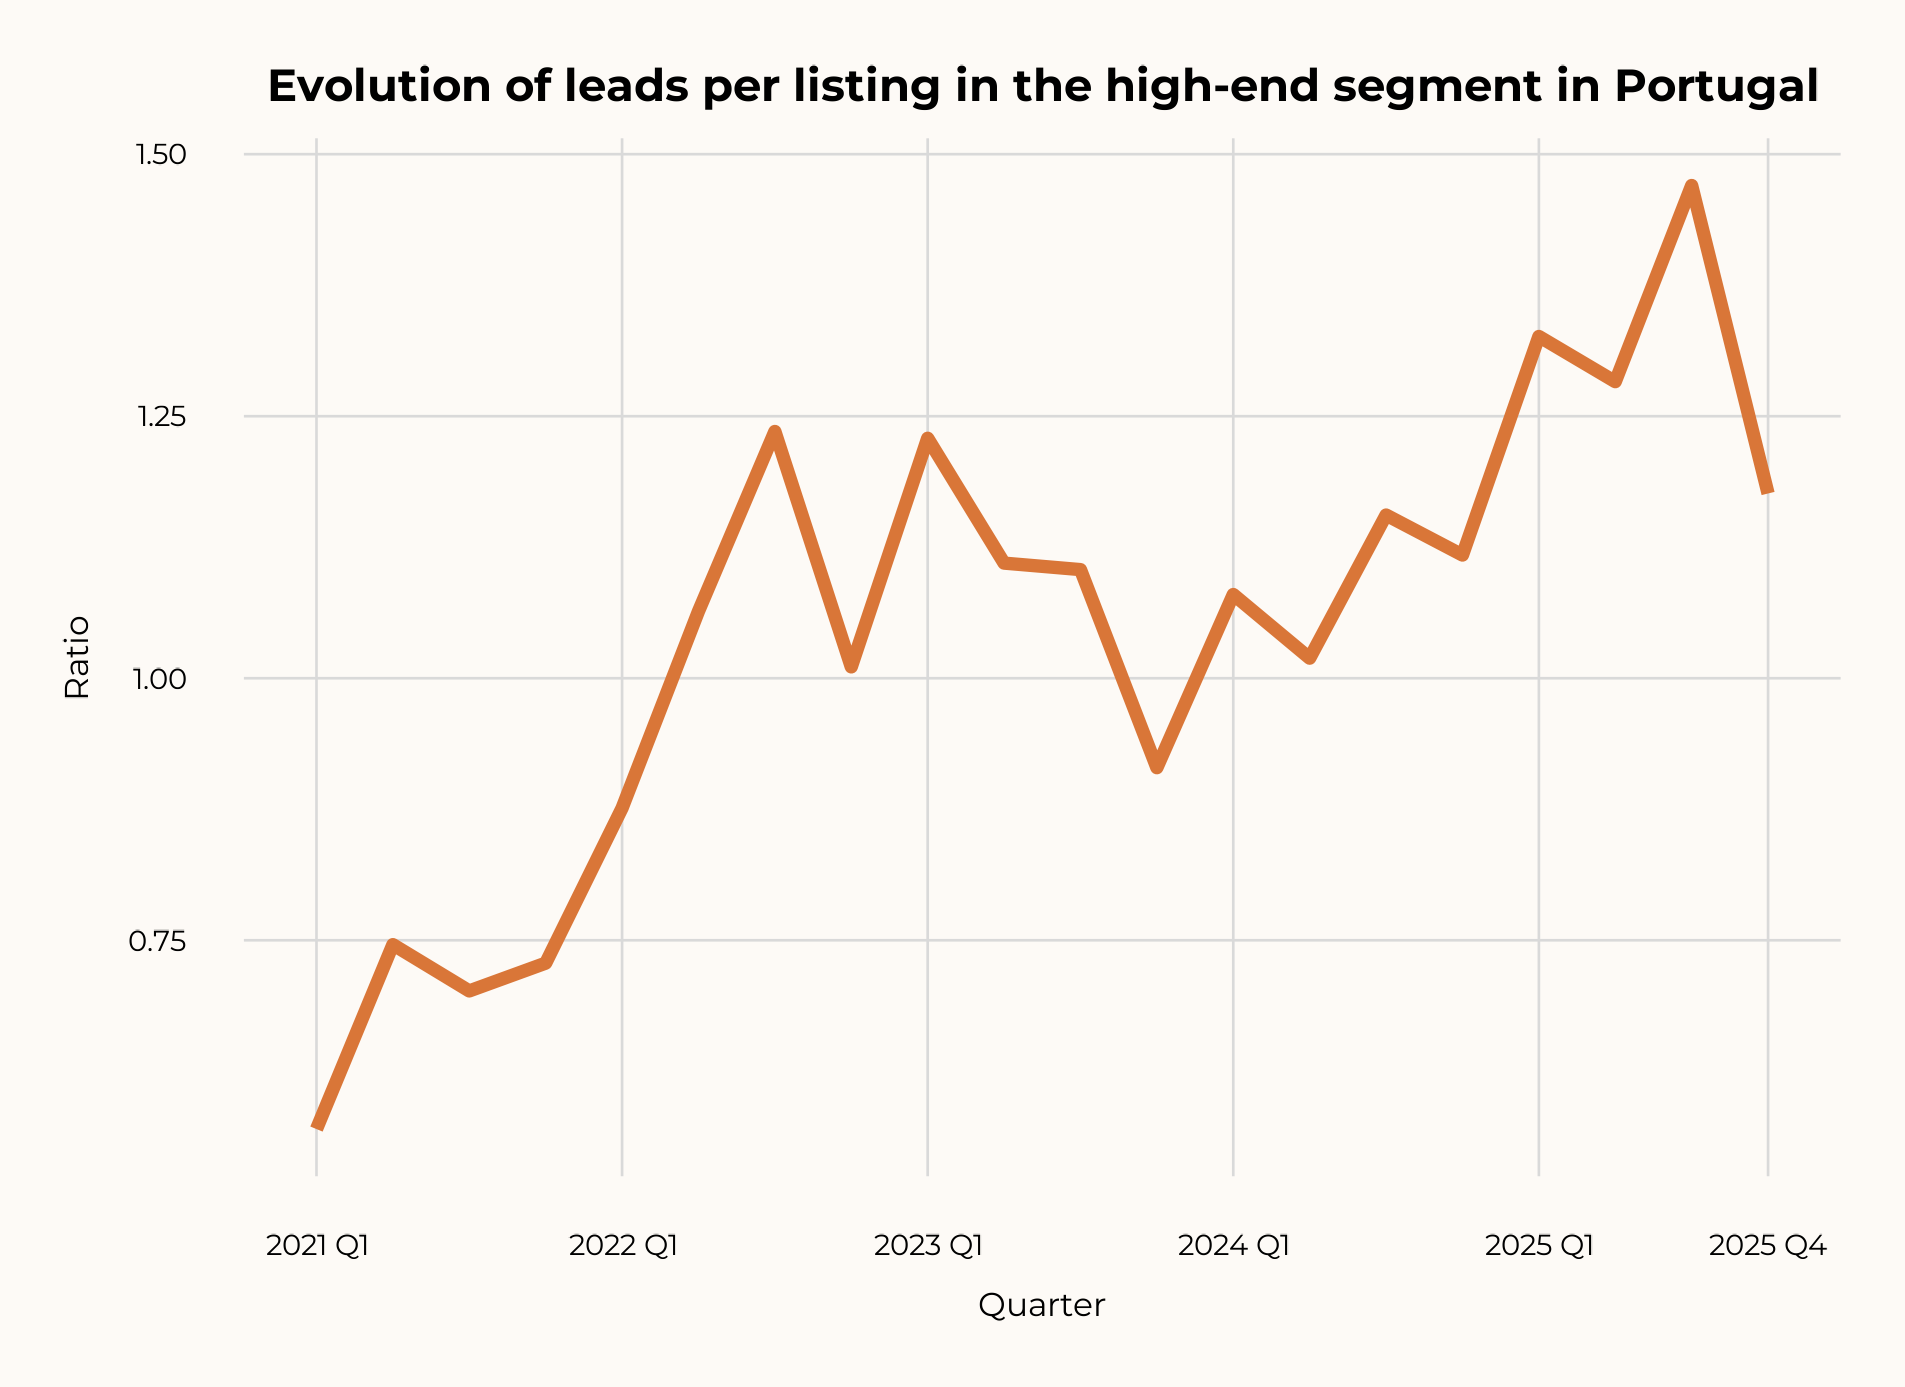
Demand pressure has more than doubled since 2021
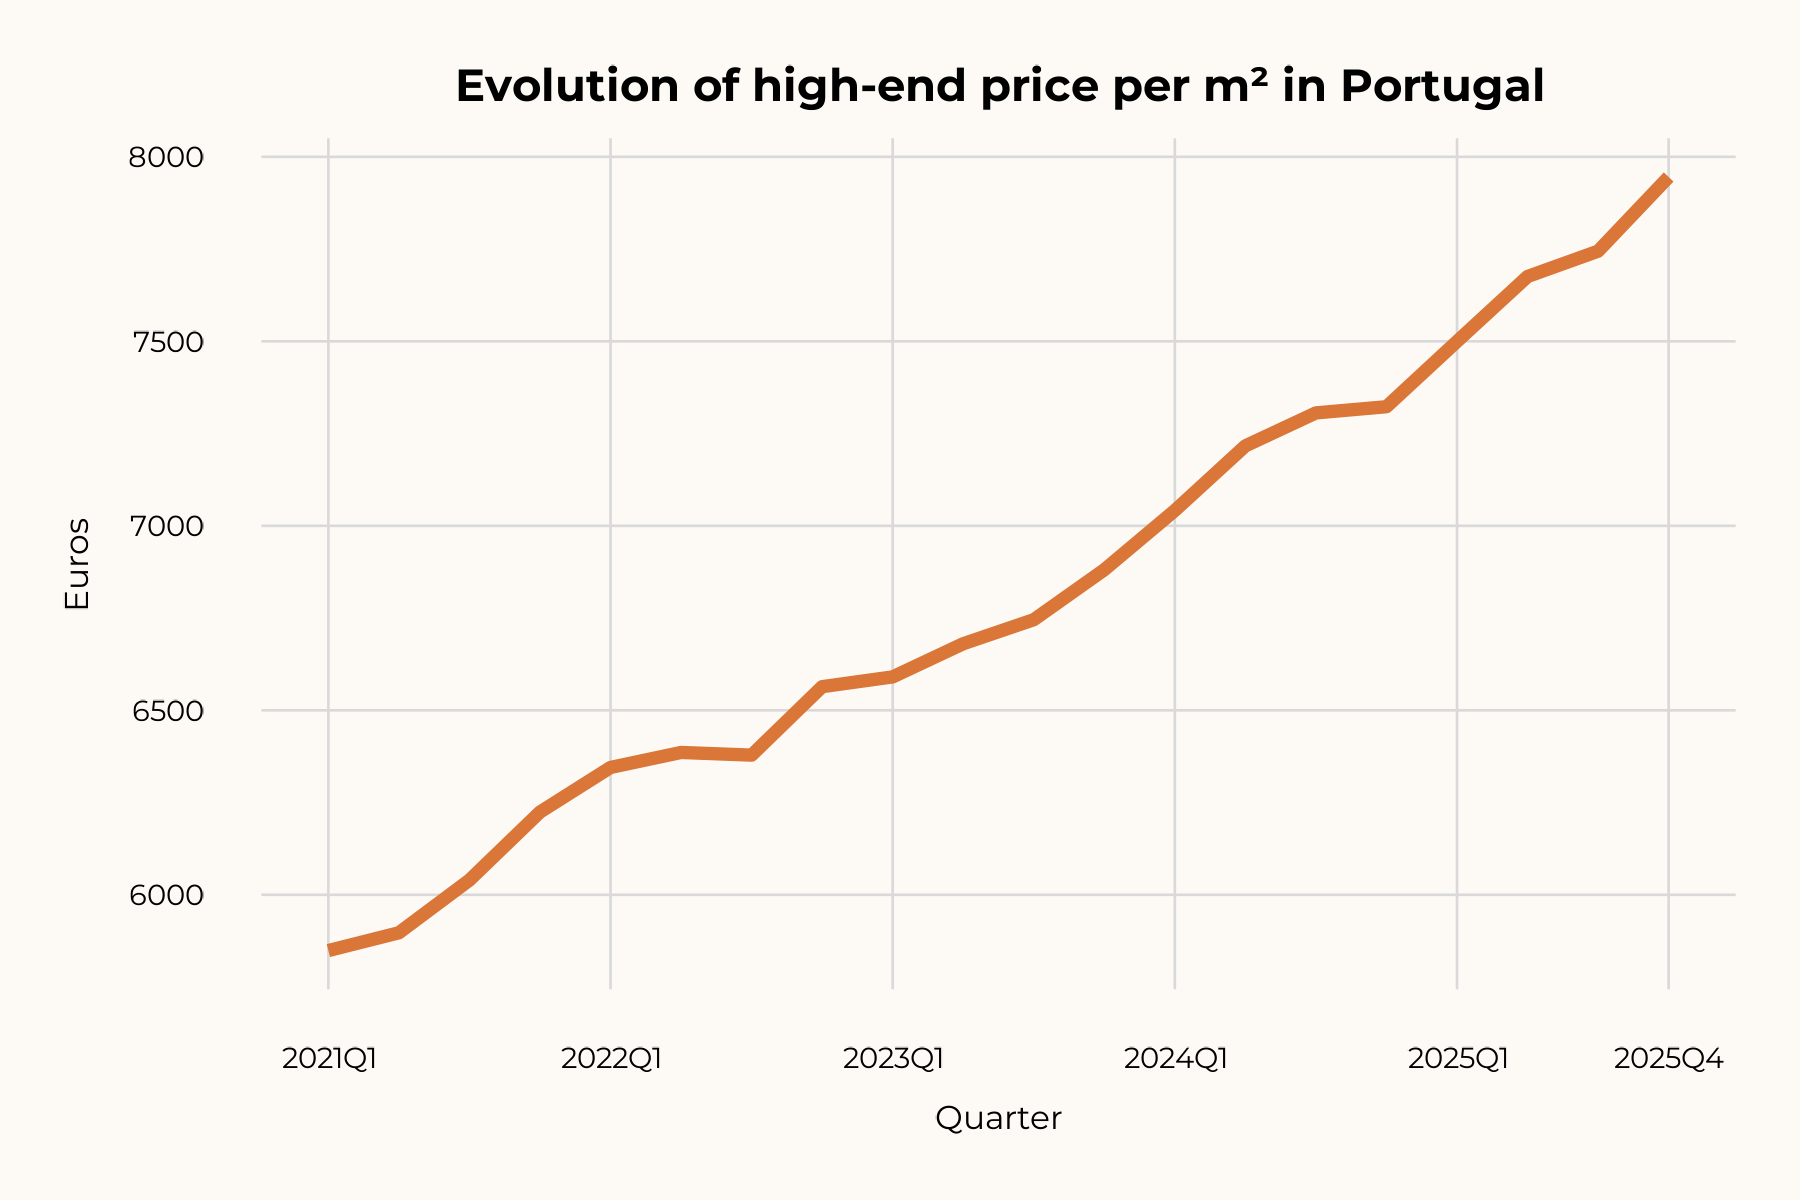
Average high-end price rose 35.8% since 2021 to 7,945 EUR/m²
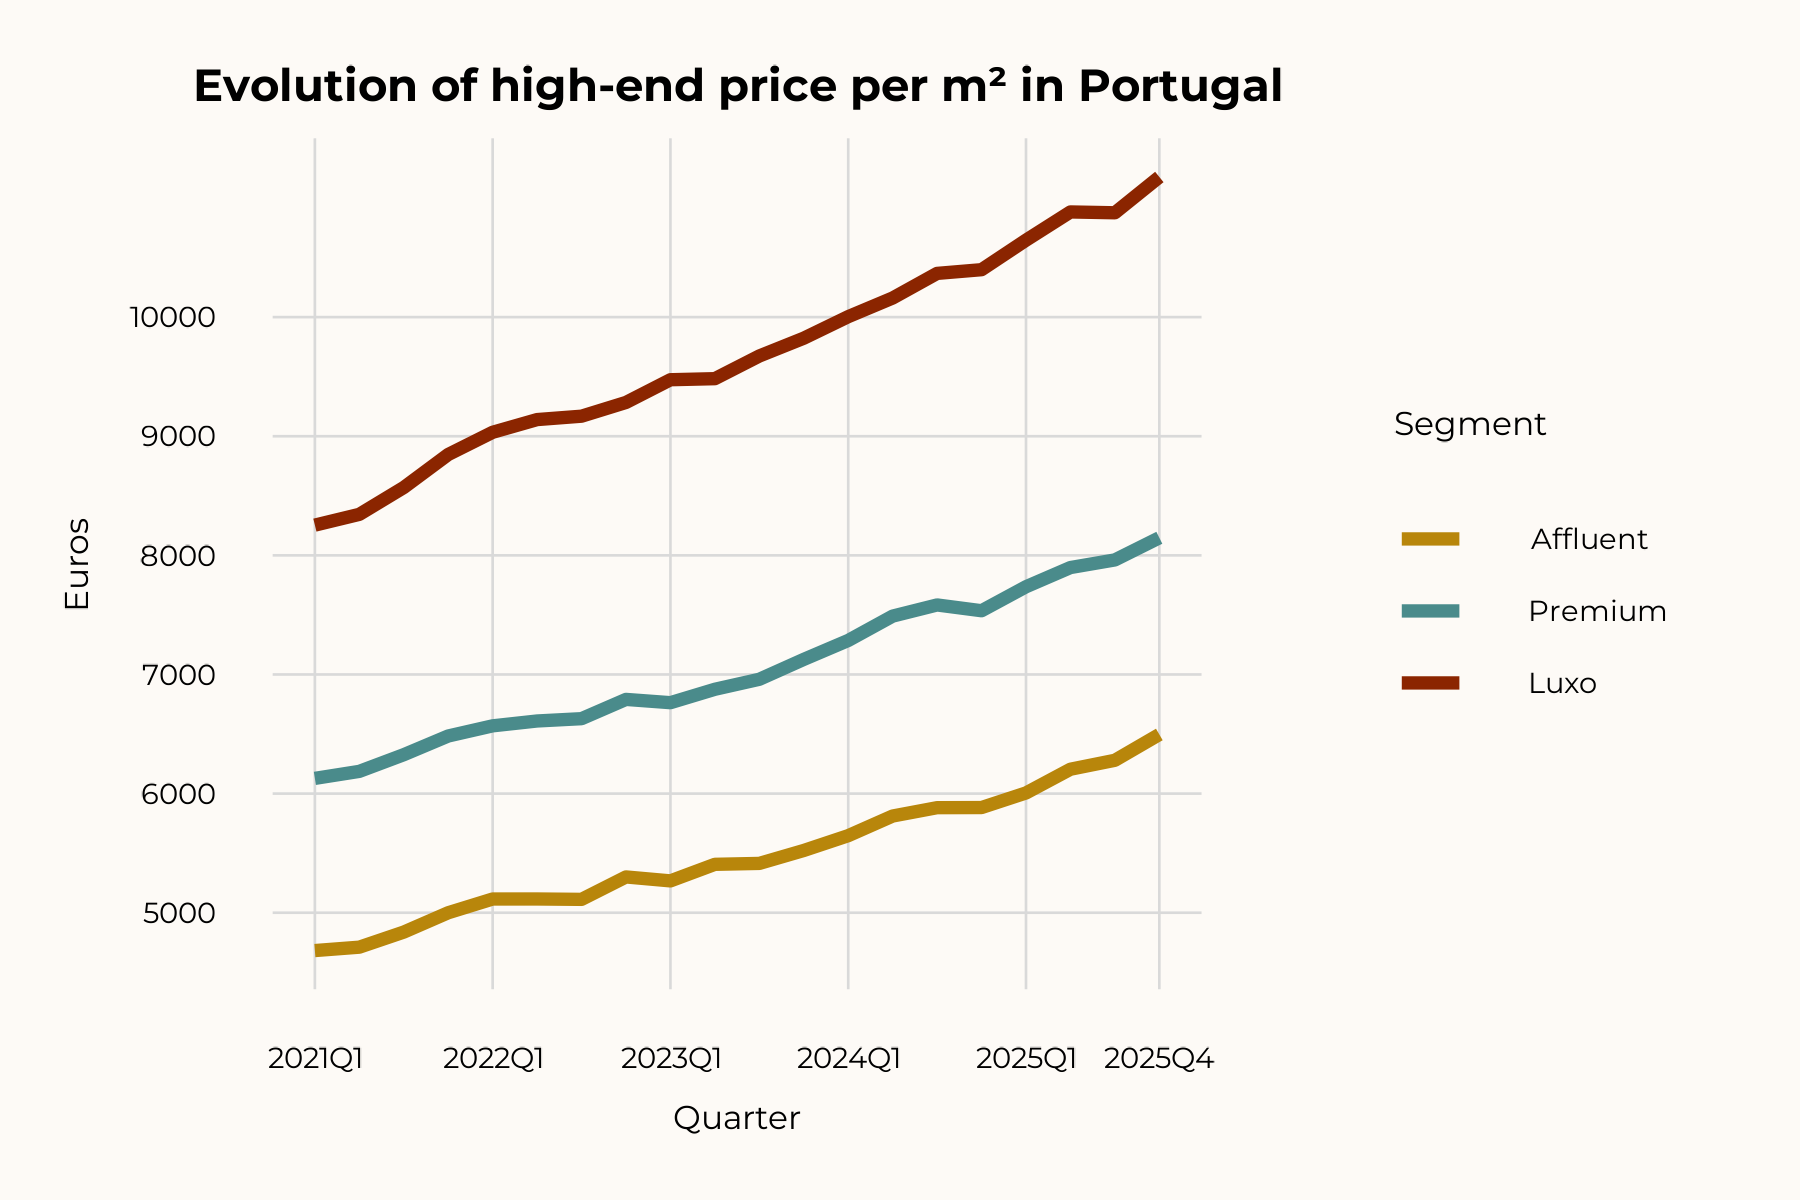
Entry-level high-end prices accelerated faster than the top — the gap is narrowing
Fastest growth
Solid growth
Moderate growth
High-end prices range from 6,800 to 35,000 EUR/m² across top locations
Price variation at the parish level
Lisboa maintains a 40–60% discount to major European capitals
Lisboa at €7,000/m² offers a 62% discount to London and 47% to Paris. Even in closer comparisons — Munich (€11,200), Milan (€9,950), Madrid (€8,550) and Berlin (€7,800) — Lisboa's prime market retains a significant appreciation margin, reinforcing its positioning as a real value opportunity for international buyers.
Source: Knight Frank; Savills; JLL; Numbeo. Average prime residential price, EUR/m², 2025.
High-end real estate accounts for nearly 2% of national GVA and over 100,000 jobs
total effect (IO)
gross value added
wages generated
peak in 2022
Economic impact recovered in 2025 after the 2023–24 contraction
| Indicator | 2021 | 2022 (peak) | 2023 | 2024 | 2025 | Δ 25/24 |
|---|---|---|---|---|---|---|
| Output (EUR M) | 5,885 | 8,174 | 7,232 | 5,523 | 5,992 | +469 |
| GVA (EUR M) | 2,954 | 4,036 | 3,565 | 2,742 | 2,988 | +247 |
| Compensation (EUR M) | 1,206 | 1,703 | 1,510 | 1,144 | 1,236 | +91 |
| Employment (FTE) | 75,181 | 106,381 | 94,314 | 71,439 | 77,108 | +5,669 |
Share of the National Economy
| Indicator | 2021 | 2022 (peak) | 2023 | 2024 | 2025 (est.) |
|---|---|---|---|---|---|
| % of total GVA (IO) | 1.58% | 1.91% | 1.51% | 1.09% | n.a. |
| % of GDP (INE) | 1.36% | 1.65% | 1.32% | 0.95% | ~0.99% |
| Employment (% of total) | 1.52% | 2.11% | 1.86% | 1.40% | n.a. |
| Nominal GDP (bn EUR, INE) | 216.5 | 244.0 | 270.4 | 289.4 | ~301.6 |
Construction is the main driver of economic impact — ~95% of total employment
| Construction | 2021 | 2022 (peak) | 2023 | 2024 | 2025 | Δ 25/24 |
|---|---|---|---|---|---|---|
| Output (EUR M) | 5,078 | 7,262 | 6,444 | 4,859 | 5,229 | +370 |
| GVA (EUR M) | 2,325 | 3,325 | 2,950 | 2,224 | 2,394 | +170 |
| Compensation (EUR M) | 1,138 | 1,628 | 1,445 | 1,089 | 1,172 | +83 |
| Employment (FTE) | 71,403 | 102,112 | 90,624 | 68,334 | 73,541 | +5,207 |
Real estate brokerage accounts for ~5% of total impact
| Brokerage | 2021 | 2022 (peak) | 2023 | 2024 | 2025 | Δ 25/24 |
|---|---|---|---|---|---|---|
| Output (EUR M) | 807 | 912 | 788 | 663 | 762 | +99 |
| GVA (EUR M) | 629 | 711 | 615 | 517 | 594 | +77 |
| Compensation (EUR M) | 67 | 76 | 66 | 55 | 63 | +8 |
| Employment (FTE) | 3,778 | 4,269 | 3,690 | 3,105 | 3,568 | +463 |
The macro environment is the most favorable since the pre-pandemic period
held after 8 cuts
2026 projection (BdP, Mar.)
2025 record (+27%)
CPI Mar. 2026: 2.7%
12M Euribor at ~2.7% (Apr. 2026) after a ~40 bp uptick since Mar. 2026; average rate on new mortgage contracts 2.83% (Feb. 2026, BdP). Real wages +3.2% YoY (2025) — the strongest purchasing power growth in over a decade.
Five forces support the positive outlook; six risks require monitoring
Opportunities
- Structural supply deficit — supports prices and margins
- Portugal as a global hub — safety, climate, quality of life
- Branded residences — 30–50% price premium and international visibility
- Nearshoring and tech — new flows of high-income professionals
- New Lisboa airport — premium connectivity enabler
Risks
- Monetary reversal — tariffs and energy shocks may reverse ECB rate cuts
- Regulation — 7.5% IMT for non-residents, short-let restrictions, foreign taxation
- Geopolitics — Portugal as a safe haven, but conflicts reduce external appetite
- Cascade effect — supply shortages push buyers into the Affluent segment, pressuring the entire chain
- Affordability — median mortgage payment doubled in Lisboa since 2019
- Entry-level leverage — public guarantee for young buyers (LTV up to 100%) accounted for ~26% of home purchases in 2024, and new loans with elevated risk profile rose from 3% to 21% in 2025 (BdP — Macroprudential Monitoring Mar 2026); does not affect the luxury segment
The 2026 fiscal package restricts foreign demand but stimulates construction
Restrictive measures (demand)
- 7.5% flat IMT for non-residents (Mar. 2026) — previously progressive 0–7.5%; now 7.5% from the 1st euro, with no exceptions
- IFICI replaced NHR (Jan. 2025) — 20% income tax rate maintained but restricted to qualified professions
- Golden Visa without real estate (Oct. 2023) — continues via funds (≥500K EUR). Citizenship: now 10 years
Pro-supply measures (construction)
- VAT 23% → 6% on construction (Sep. 2025) — units up to 660,982 EUR. High-end above this threshold does not benefit
- Simplex Urbanistico (Mar. 2024) — result: +20.1% dwellings licensed in 2025
- Short-let restrictions lifted (Nov. 2024) — regulation returned to municipalities
Portugal leads Europe in branded residences — qualitative differentiation in the luxury segment
Luxury residences
Exclusive villas
Residential resort
Eco-resort
Lifestyle residences
The Affluent segment is the new gateway — and the primary growth frontier
+5.3% YoY
among all 3 segments
varies by parish
Why Affluent?
- At scale, the Affluent segment remains the most attractive for new construction
- Premium and Luxo locations are primarily rehabilitation in regulated areas
- The 6% VAT on construction applies up to ~€648K (luxury segment NOT eligible — caps out below) — directly benefiting this segment
Emerging areas
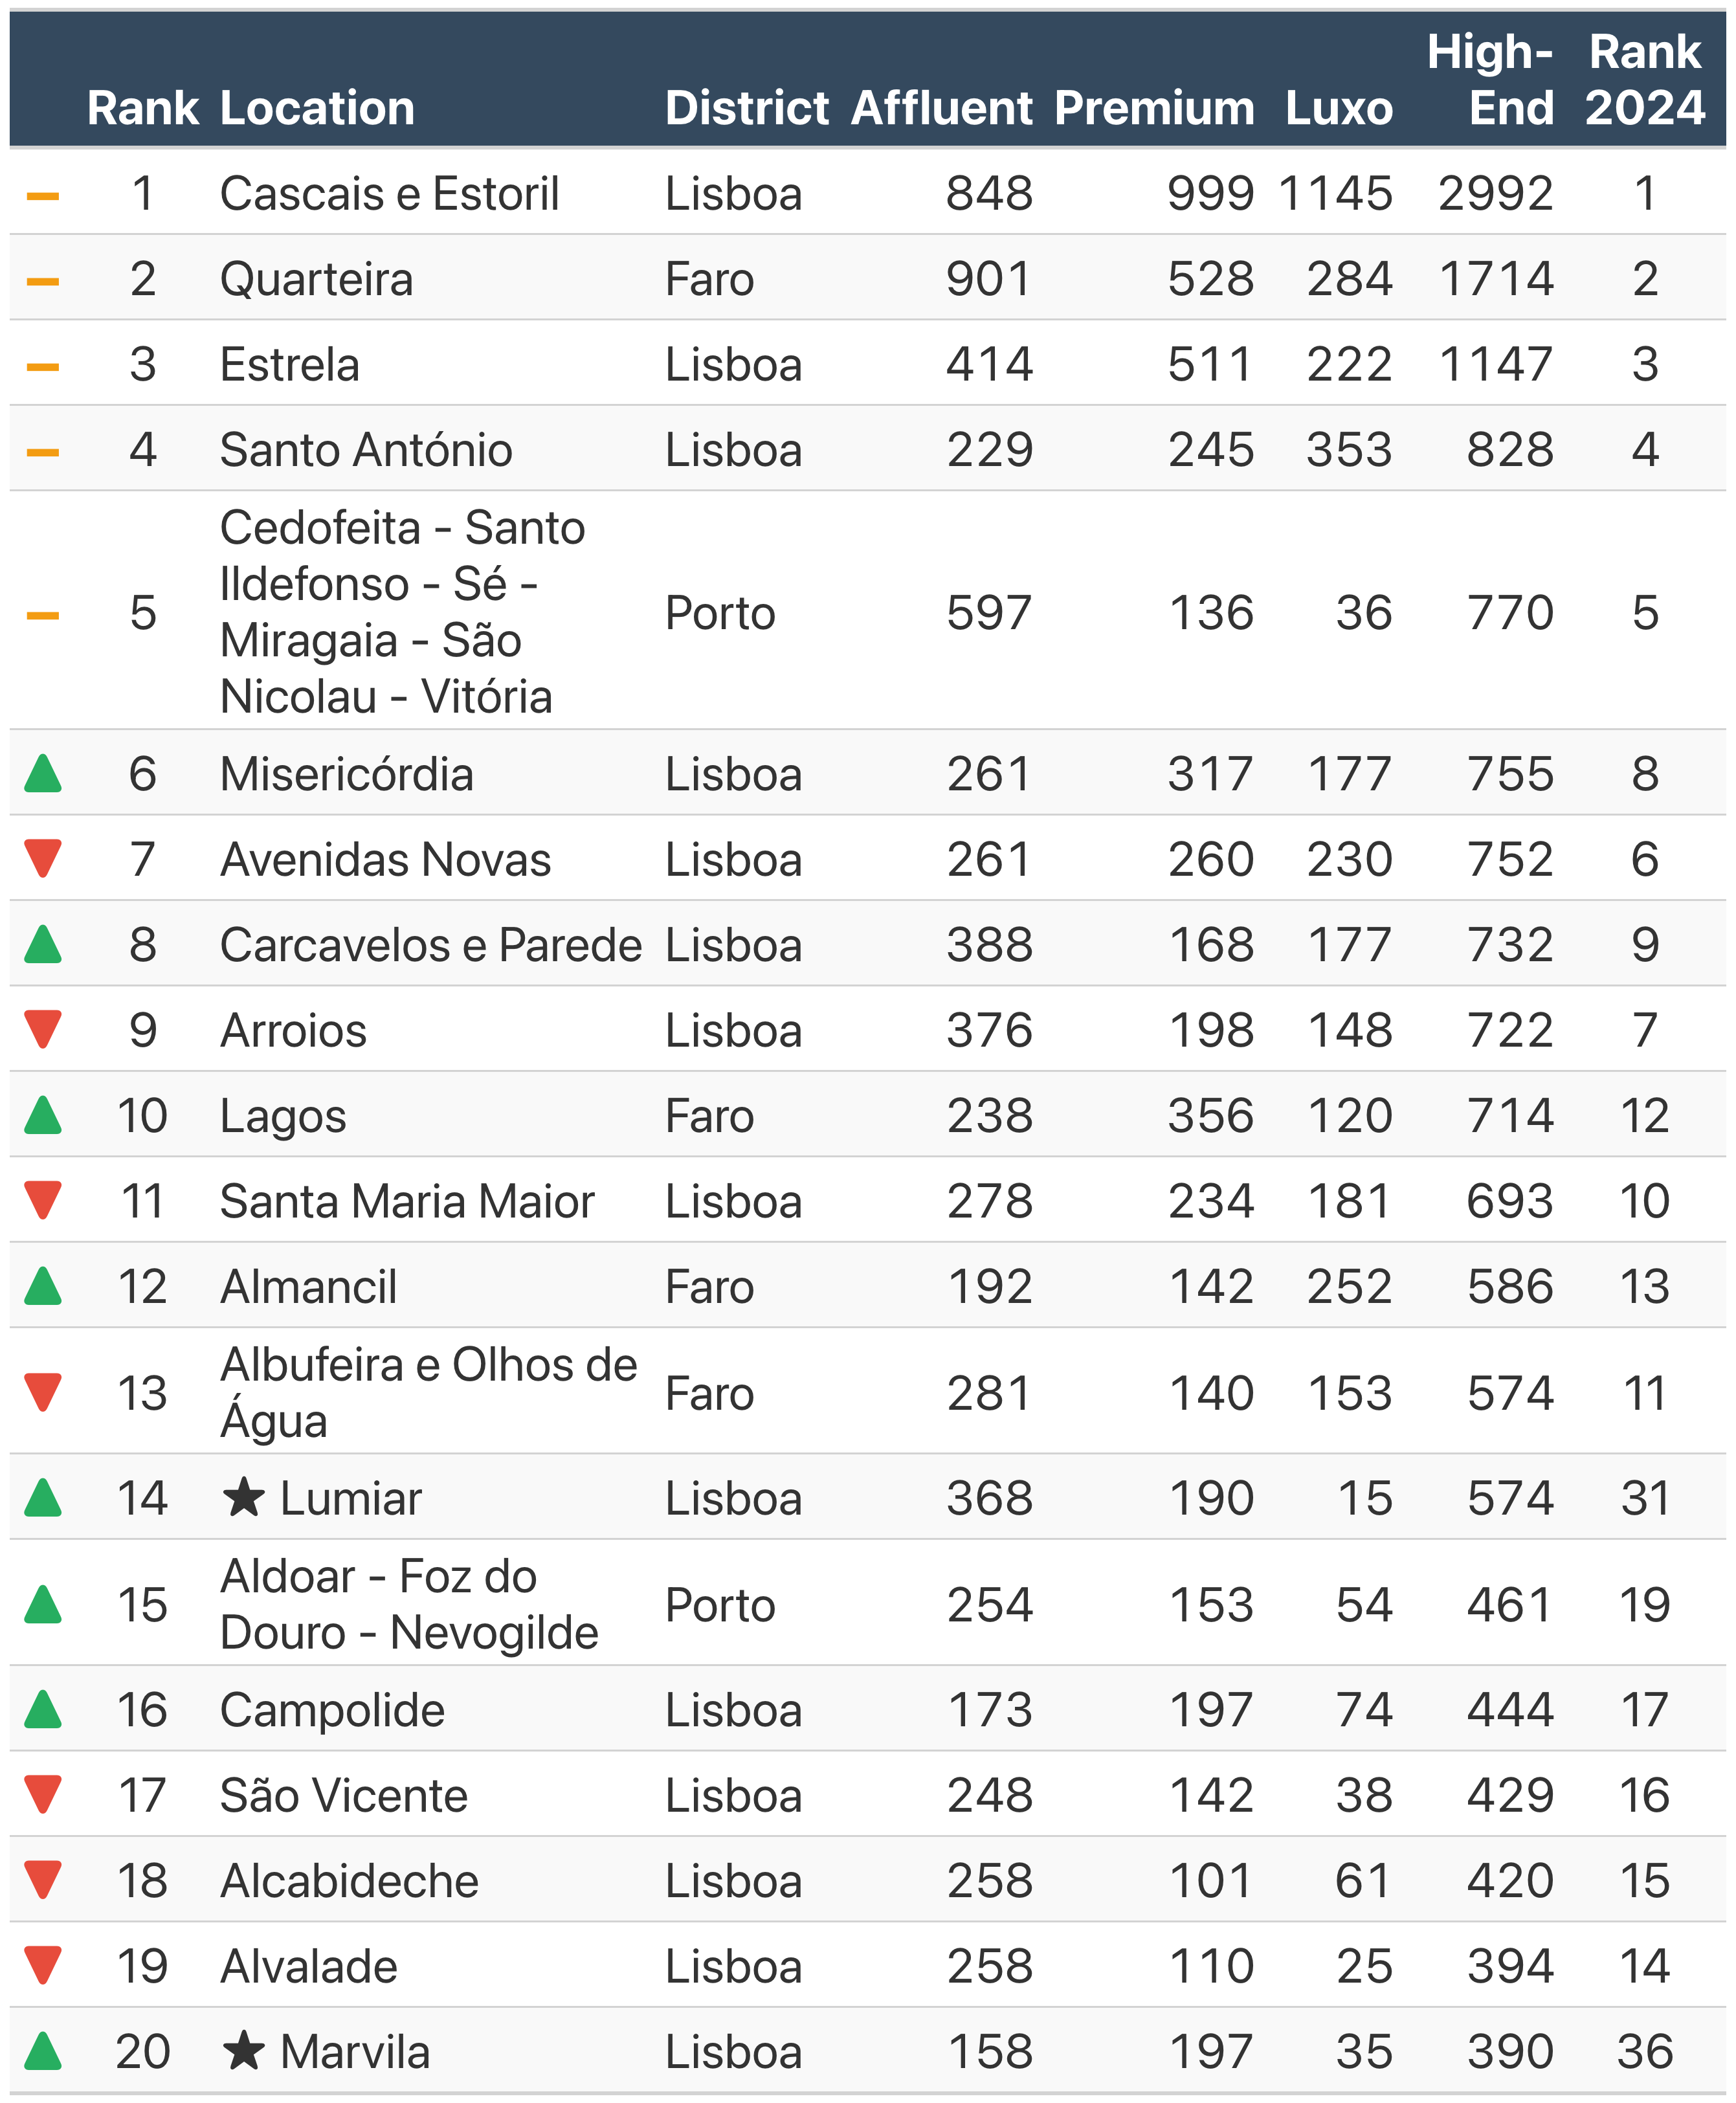
- Lumiar — +132% supply (+327 units), new in the Top 20
- Marvila — +136% supply (+225 units), new urban frontier
- Paranhos (Porto) — +89% supply, northward expansion
- Common factor: accessibility and transport as catalysts
The literature suggests a 7–12% premium from metro proximity
metro proximity in Lisboa
4 stations, 11M pass./year
17 stations, light metro
Academic evidence
- Martinez & Viegas (2009), Transp. Research Record: 1 metro line +6.5–8.8%; 2 lines +9.2–12.5% (Lisboa)
- Debrezion et al. (2007), meta-analysis: average residential premium +4.2% for station proximity
- Agostini & Palmucci (2008), Fiscal Studies: appreciation of +4–8% starts after announcement
Potential implications
- Red Line (Alcantara): Campo de Ourique, Infante Santo — areas with appreciation potential
- Purple Line (Loures-Odivelas): potential northward market expansion
- Areas already accelerating: Lumiar (+132%), Marvila (+136%)